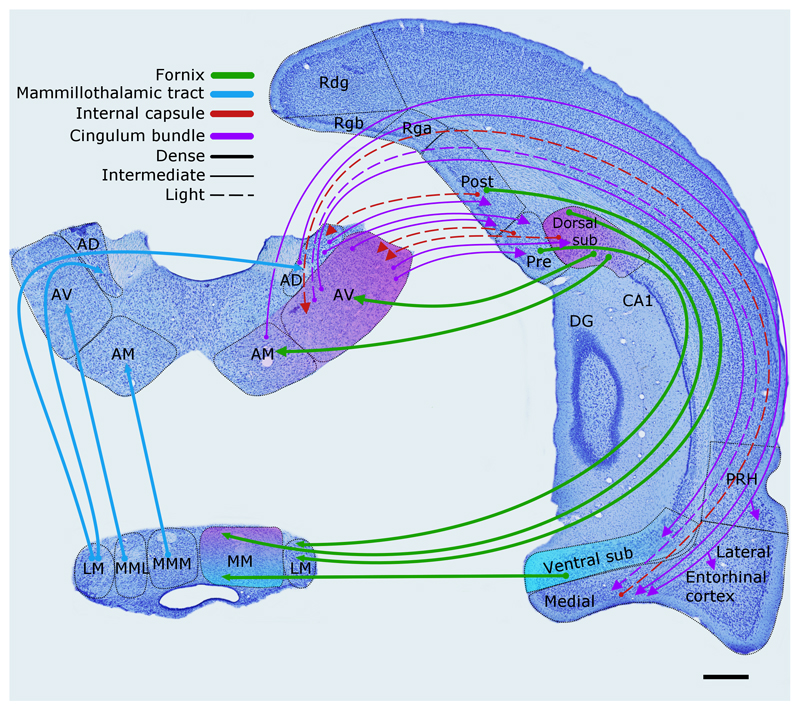
Figure 3.
The rat brain. Depiction of the connections between the hippocampal and parahippocampal regions with the mammillary bodies and anterior thalamic nuclei, as well as the projections from the mammillary bodies to the anterior thalamic nuclei. The routes of these connections are distinguished by different colours. The origin of a connection is denoted by a circle and the termination is signified by an arrowhead, while a reciprocal connection that follows the same route has an arrowhead at both ends. The style of the lines reflects the strength of the connections (thick line = dense, thin line = intermediate, dashed line = light). The upper left panel shows the anterior thalamic nuclei, while the lower left panel depicts the mammillary bodies. AD: anterodorsal nucleus; AM: anteromedial nucleus; AV: anteroventral nucleus; CA1–3: CA fields of the hippocampus; DG: dentate gyrus; LM: lateral nucleus of the mammillary bodies; MM: medial nucleus of the mammillary bodies; MML: lateral division of the medial mammillary nucleus; MMM: medial division of the medial mammillary nucleus; Post: postsubiculum; Pre: presubiculum; PRH: perirhinal cortex; Rdg: dysgranular retrosplenial cortex (area 30); Rga: Rgb: subregions within granular retrosplenial cortex (area 29); Sub: subiculum. Scale bar = 500 μm.

