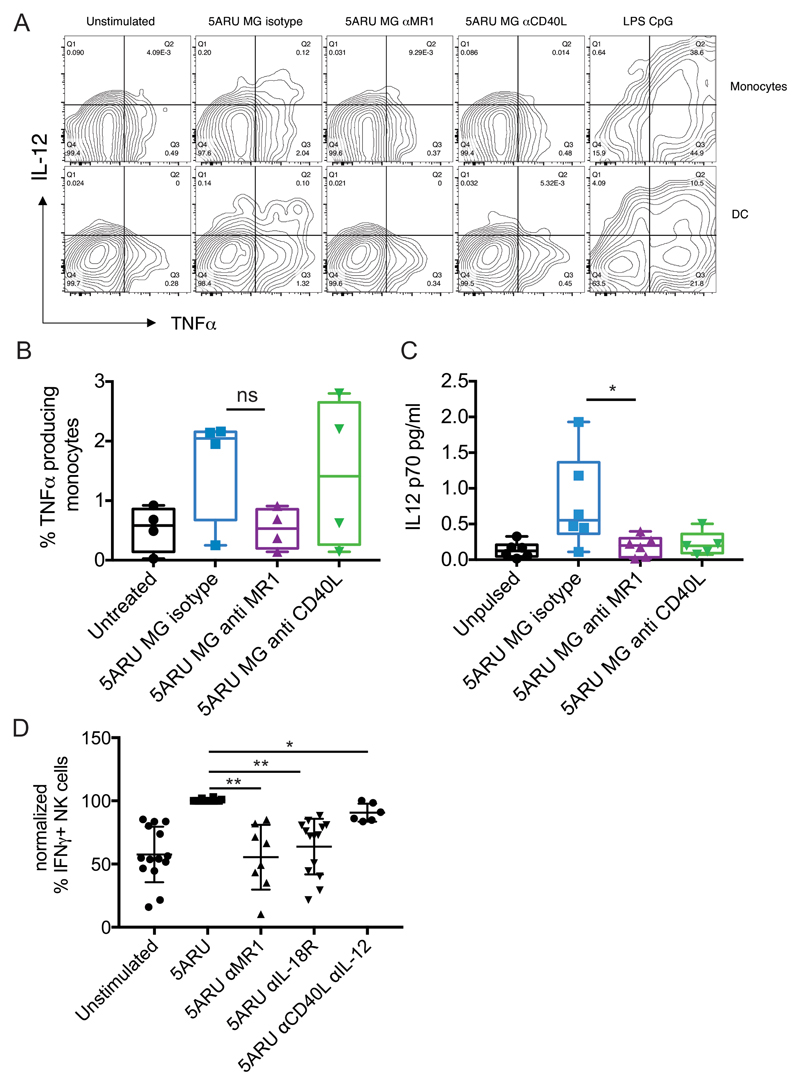
Figure 7.
A) FACS dot plots showing intracellular expression of IL-12 and TNF-α in monocytes and DC (gated as in Fig. 6 and supplemental Fig. 4), 16 hours after incubation with 5-A-RU/MG in the presence or absence of anti-MR1 or anti-CD40L blocking antibodies. Profiles of LPS and CpG stimulated cells are shown as positive control. B) Cumulative data for the intracellular TNF-α expression described in A. Data are depicted as box and whiskers, with all points indicated +/ SD (n=4). C) IL-12p70 detected by Simoa immunoassay in whole blood stimulated for 16 hours with 5-A-RU/MG in the presence or absence of anti-MR1 or anti-CD40L blocking antibodies. Cumulative data (n=6, 5 for anti CD40L) depicted as box and whiskers, with all points indicated +/ SD; * denotes p<0.05. D) PBMC were stimulated with 5-A-RU/MG in the presence or absence of blocking antibodies to MR1 (n=8), IL-18R (n=14), IL-12 and CD40L (n=6) and the percentage of IFN-γ secreting NK cells was determined by FACS after 16 hours. The response with antigen was normalised to 100%; we observed background IFN-γ in the majority of the donors tested. Each symbol represents a donor; * denotes p<0.05, ** denotes p<0.01.

