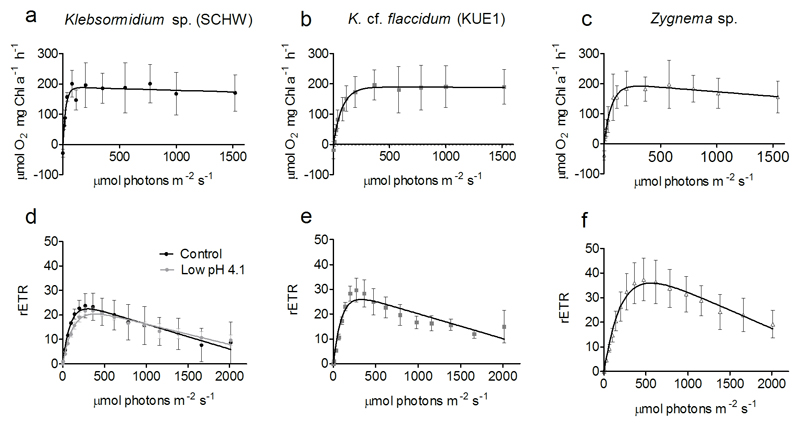
Fig. 5.
Photosynthetic characteristics of Klebsormidium and Zygnema. a, b and c are P vs I curves measured as an assessment of the photosynthetic responses to slow light increase. d, e and f are RLCs used as an assessment of the photosynthetic responses to rapid increase of light. Figure d includes RLCs for Klebsormidium sp. (SCHW) exposed for 24 hours at pH 4.1. Vertical bars indicate standard deviations of at least three independent replicates

