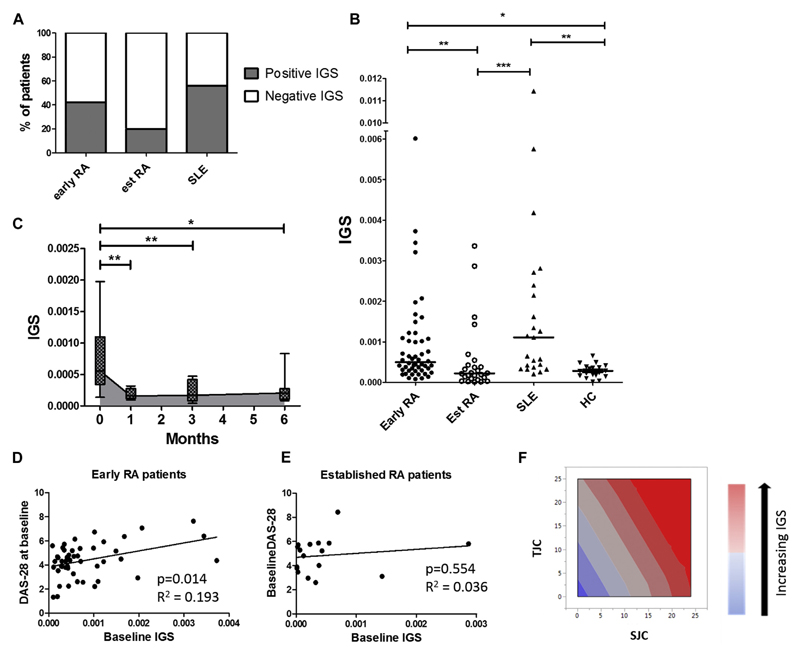
Fig 1.
IGS in patients with early RA: Prevalence and disease activity associations. Patients with early RA (n = 50), established RA (n = 25), and established SLE (n = 23) and healthy control subjects (HC;n = 23) had their whole blood IGS measured. A, Proportion of patients with a positive IGS in patients with early RA (42%), established RA (21%), and SLE (56%). B, IGS expression across different disease cohorts. C, Patients with early RA (n = 11): longitudinal IGS expression at baseline (0 months) and 1, 3, and 6 months after initiation of DMARD therapy. Gray shading depicts median IGS. Box and whisker plots show medians and interquartile ranges. For both Fig 1, B and C, analysis included rank transformation of IGS scores, which were tested for differences between groups after adjustment for age and sex with the Tukey multiple comparison test applied. D and E, Plot depicts age- and sex-matched multiple regression between baseline IGS and baseline DAS28 scores in patients with early (Fig 1, D) and established (Fig 1, E) RA. F, Swollen joint count (SJC; P = .017) and tender joint count (TJC; P = .043) were the key drivers of association between baseline DAS28 scores and baseline IGS. Multiple regression analysis: *P < .05, **P < .01, and ***P < .001.

