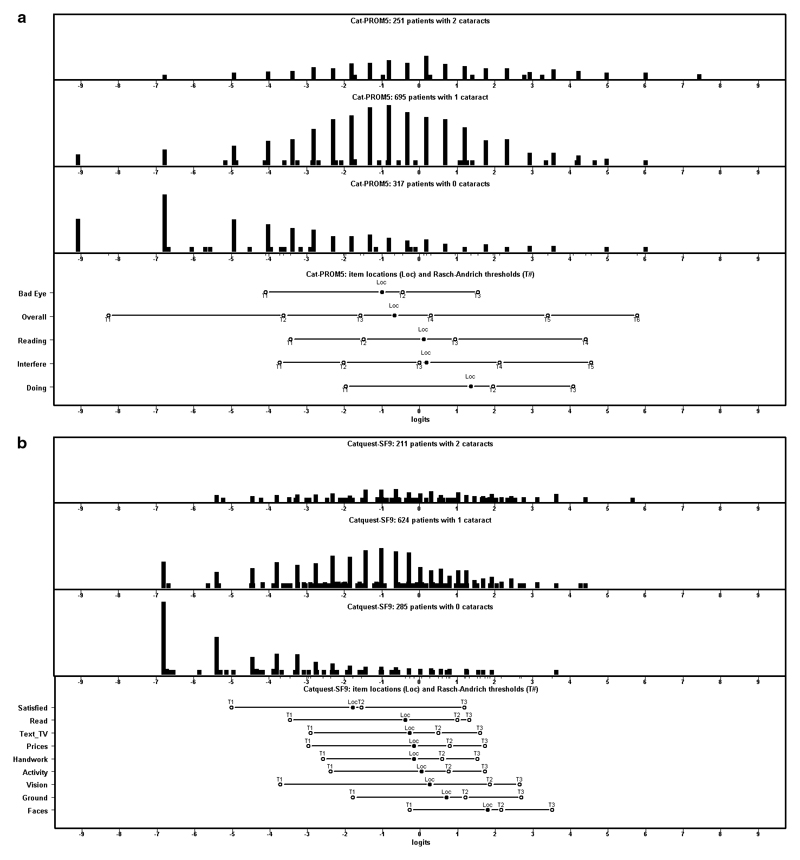
Figure 2.
Person-Item or Wright’s maps illustrating the distributions of patient responses in the upper panel from those with 2 cataracts, in the second panel from those with 1 cataract (a cataract in one eye and either pseudophakia or a clear crystalline lenses in the other), and in the third panel those with no cataracts (either bilateral pseudophakia or pseudophakia in one eye and a clear crystalline lenses in the other). The lower panel in Figure 2a shows the positions of the Item Locations (Loc) and Category Thresholds (T#) for Cat-PROM5 and Figure 2b shows these similarly for Catquest-9SF. All panels refer to the same horizontal scale from -9 to +9 logits.

