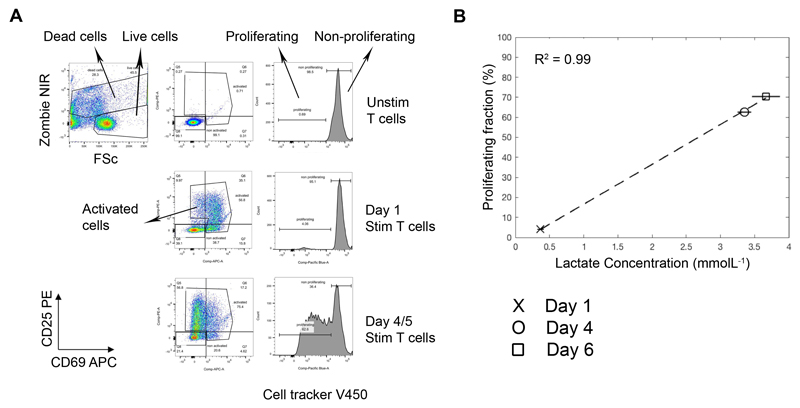
Figure 2. Increased total extracellular lactate correlates with increasing proliferation in stimulated T cell cultures.
Cell proliferation tracker V450 labelled T cells were cultured in the presence and absence of anti-CD3/28 dynabeads for 6 days. At days 1, 4 and 6, cell culture supernatants were sampled for lactate analysis and cells were analysed by flow cytometry for proliferation status (cell proliferation dye dilution) as well as counterstained with dead cell marker (zombie NIR) and antibodies to CD69-APC and CD25-PE. The flow gating strategy is shown in (A): dead cells, activated cells, proliferating and non-proliferating cells were gated. The correlation of total extracellular lactate concentration with T cell proliferation is shown in (B).

