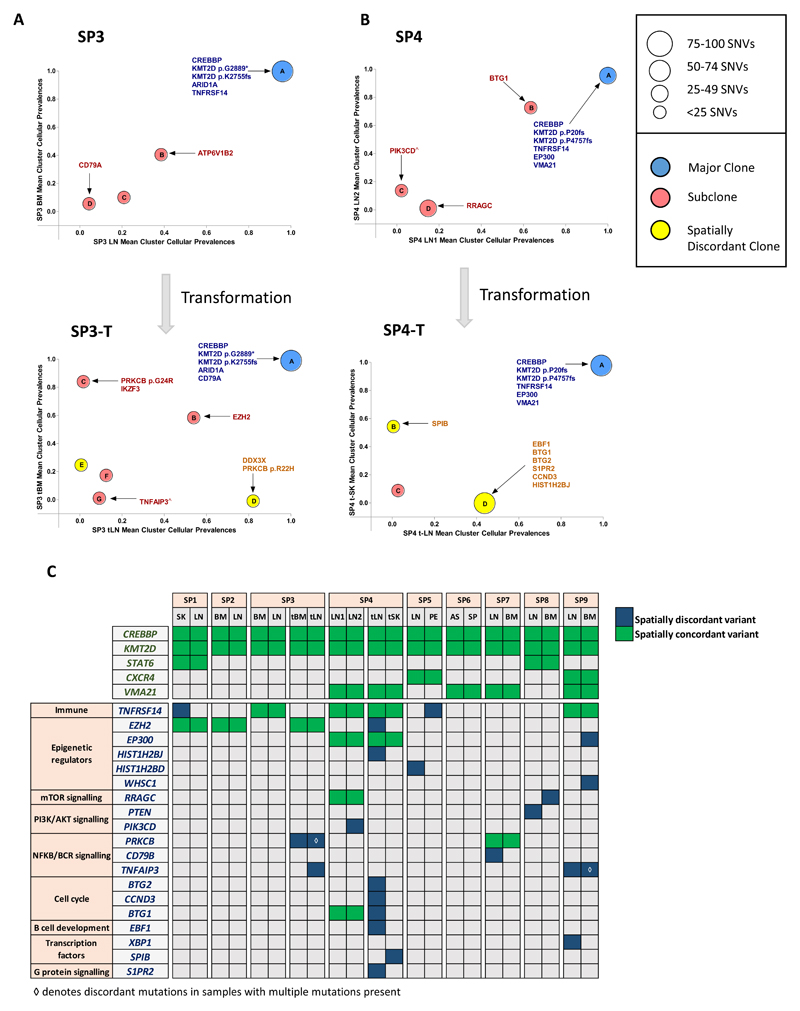
Figure 2. Spatial heterogeneity at transformation and in genes with putative biological, prognostic or therapeutic relevance.
(A) Mean cluster cellular prevalence plot for SP3 at diagnosis (top) and transformation (bottom) to DLBCL. (B) Mean cluster cellular prevalence plot for SP4 at FL (top) and transformation (bottom) to DLBCL. ^site specific variant, although the mean cluster cellular prevalence is reported as marginally subclonal. (C) Heatmap demonstrating degree of spatial heterogeneity (mutations and copy number changes) in driver genes. At the top, alterations such as those in CREBBP and KMT2D are found in all cases. Gene names listed in green always had spatially concordant variants whilst genes listed in blue demonstrate at least one instance of spatial discordance.

