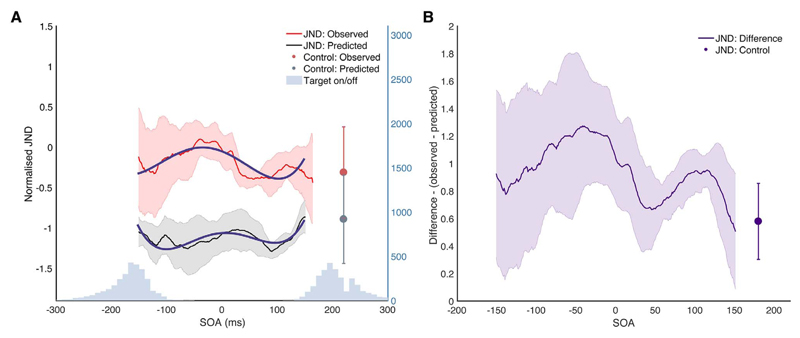
Fig. 4.
Observed vs predicted integration performance. (A) Shows this observed integration performance compared to the predicted integrated performance calculated using the peripheral and foveal weights alone, as described above. If foveal and peripheral information are being integrated in an optimal manner, the observed and predicted performance should be equal. If the presentation of the attentional distractor disrupts integration, observed integration performance should be worse than the predicted performance, so JNDS should be higher. Fitted models for growth curve analysis are shown in blue. (B) Shows the difference between observed and predicted performance for the distractor condition and control condition. (For interpretation of the references to colour in this figure legend, the reader is referred to the web version of this article.)

