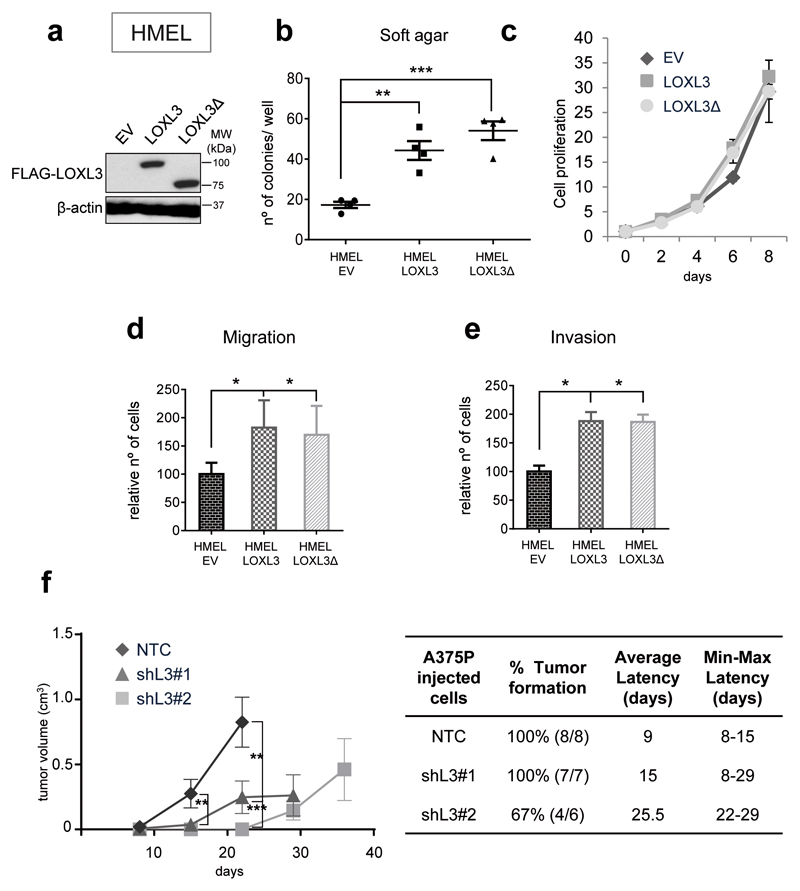
Figure 3.
LOXL3 contributes to transformation of immortalized melanocytes and favors tumor growth. (a) HMEL immortalized melanocytes were infected with GFP lentiviral particles expressing empty vector (EV), FLAG-LOXL3 or FLAG-LOXL3Δ and GFP-positive sorted cells were analyzed for the expression of LOXL3 isoforms by western blot. β-actin was used as a loading control. MW of protein standards (kDa) is indicated. (b) Soft-agar colony formation assay of HMEL melanocytes transduced as in (a). Error bars represent sem, n=4 biologically independent replicates. (c) Cell proliferation of HMEL melanocytes transduced as in (a). Cell proliferation is shown for each cell line with three experimental replicates; error bars represent sem. The experiment was repeated twice with similar results. (d and e) HMEL immortalized melanocytes transduced as in (a) were analyzed in migration (d) and invasion (e) assays. Graphs show the number of migrating and invading cells quantified after cell fixation and staining. Error bars represent sd, n=3 biologically independent experiments. (f) A375P NTC, shL3#1 and shL3#2 xenografts were grown in nude mice (n=8 for NTC, n=7 for shL3#1 and n=6 for shL3#2) and tumor volume was measured every week (left). Error bars represent sem. The percentage of tumors developed (incidence) in each group and the required days from cell injection until the tumors were measurable (latency) is shown on the middle. The average latency and minimal and maximal days for latency in each group is also indicated (right). *p<0.05, **p<0.01, ***p<0.001 by a two-sided Student’s t-test (b and d-f).

