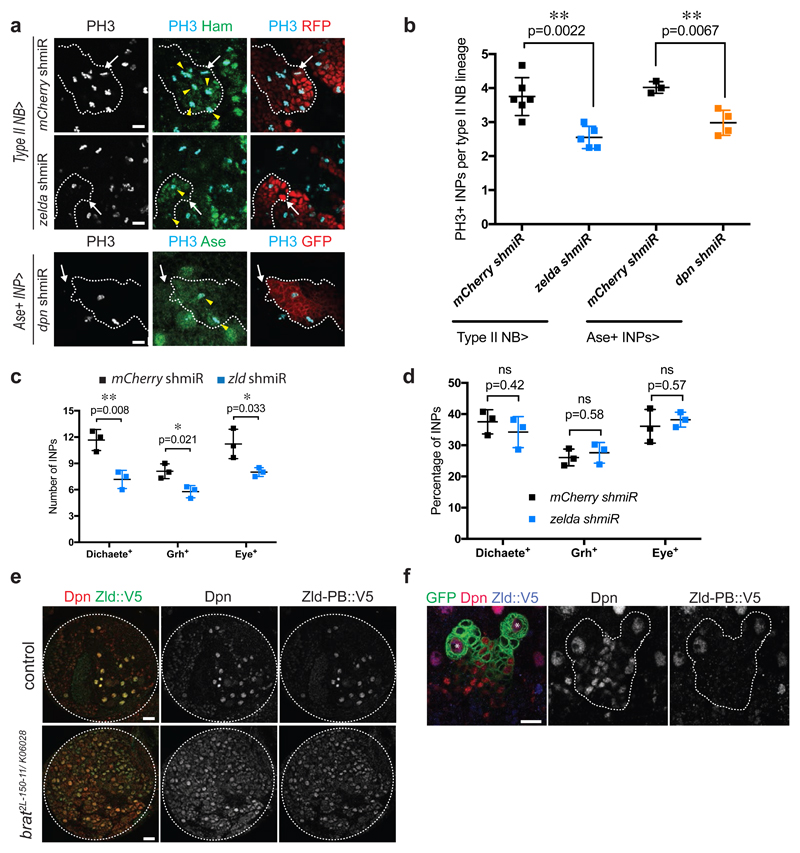
Figure 3. Zelda is required for proliferation potential, but not differentiation patterns of INPs.
(a) Close-up images of mCherry and zld shmiR type II NB lineages marked with nuclear RFP (red, upper panels) or membrane-bound GFP (red, lower panels) and stained for INP marker Hamlet or Ase (green) and PH3 (light blue). Note that in zld and dpn shmiR type II NB lineages contain less proliferative INPs (yellow arrowheads). White arrows designate the position of type II NBs. (b) Quantification of PH3-positive INPs in type II NB lineages expressing mCherry or zld shmiR (induced with wor-Gal4, ase-Gal80) or mCherry and dpn shmiR (induced with ase-Gal4) (three or more independent experiments). (c) Cell-count and (d) relative proportions of Dichaete-, Grainy head (Grh)- and Eyeless (Eye)-positive INPs of mCherry and zld shmiR (induced with wor-Gal4, ase-Gal80) type II NB lineages. While their global number is reduced, the proportions between each temporal state of INP is maintained in zld shmiR type II NB lineages. (e) Brain lobes of control and brat2L-150-11/ K06028 trans-heterozygous expressing endogenous Zld-PB::V5 stained for Dpn (red) and V5 (green). (f) Close-up images of type II NB lineages marked by membrane-bound GFP expressing endogenous Zld-PB::V5 stained for Dpn and V5. Note that Zld-PB::V5 is only expressed in NBs but absent from their progeny. *type I NB, **type II NB.
Pictures and plots are representative of three or more independent experiments.
Error bars represent standard deviation. Statistical analyses were done using T-test. *p<0.05 **p <0.01; ns: non-significant. Scale bars, 10 μm (a, f, h close-ups), 20 μm (e, h overviews).
See also Appendix Figure S6 and S7.

