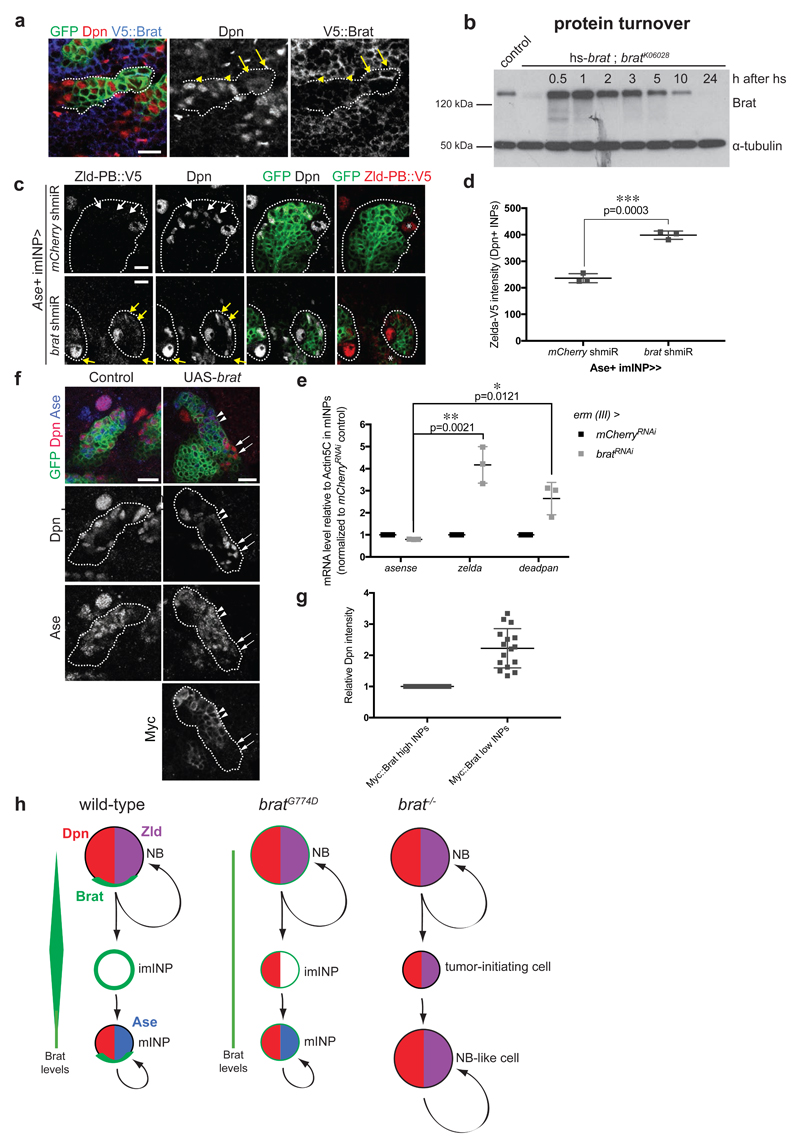
Figure 6. High Brat levels are required to repress Dpn.
(a) Close-up images of larval brains expressing brat shmiR and membrane-bound GFP from type II NB driver (wor-Gal4, ase-Gal80) and stained for Dpn (red) and V5-Brat (blue). Yellow arrows and arrowheads indicate Dpn-negative immature INPs and Dpn-positive mature INPs respectively. (b) Western Blot analysis showing Brat protein turnover. Flies expressing Brat under control of the heat-shock promoter (hs-brat) were heat-shocked for 1 h and Brat expression was determined at indicated time points after heatshock. Note that around 1 h Brat expression reaches its maximum and after 5-10 h the expression level is strongly reduced. (c) Close-up images of type II NB lineages expressing endogenous V5-tagged Zld-PB and expressing membrane-bound GFP, mCherry or brat shmiR from Ase+ INPs driver (erm-Gal4, 3rd chromosome) stained for Dpn and V5 (red). Note brat shmiR INPs re-express Zld-PB::V5 (yellow arrows) compared to mCherry shmiR INPs (white arrows). (d) Quantification of Zld-PB::V5 signal (intensity normalized by the INPs’ outlined surface, imageJ) from mCherry and brat shmiR Dpn-positive INPs per lineage. (e) qPCR analysis of Ase (negative control), zld and dpn transcripts after brat RNAi in FACS-sorted Ase+ INPs (erm-Gal4, 3rd chromosome). (f) Close-up images of type II NB lineages expressing membrane-bound GFP and myc-tagged Brat from the Ase-positive imINP driver (erm-Gal4 on the 3rd chromosome) and stained for Dpn (red) and Myc. mINPs expressing high (arrowheads) and low (arrows) Myc-Brat are indicated. (g) Quantification analysis of Dpn fluorescence intensity measurements in mature INPs expressing high levels of Myc-Brat (closer to the NB) versus in INPs expressing low levels of Myc-Brat (more distant to the NB). White asterisks indicate type II NB. (h) Model of Brat-mediated repression of Zld and Dpn in type II NB lineages.
Pictures and blots are representative of three independent experiments. Error bars represent standard deviation. Statistical analyses were done using T-test. **p<0.01 ***p<0.001 ****p<0.0001. Scale bars, 10 μm.
See also Appendix Figure S11.

