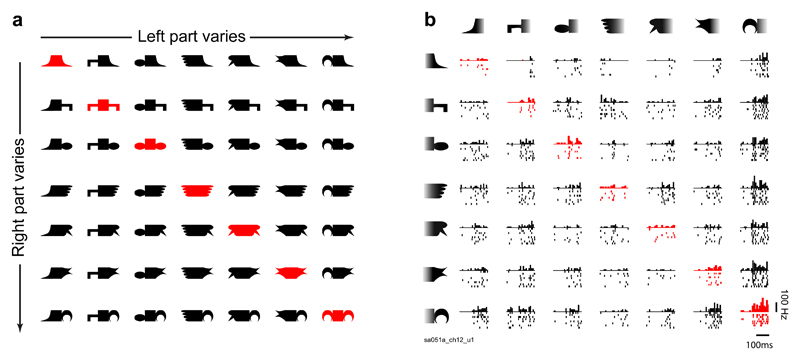
Figure 1.
Stimuli (a) and example responses in monkey inferior temporal (IT) cortex (b). Each neuron was tested with horizontally and vertically oriented versions of these shapes, but results are shown here for horizontal objects for ease of exposition (for vertical objects, see Section 1 in the Supplemental Material). Each object was created by attaching two parts on either side of a stem. Objects along a row or column share the same part on the right or left side, respectively. Symmetric objects are highlighted here in red only for the purposes of illustration; asymmetric objects are shown in black. All objects were presented in white against a black background. The plot in (b) shows responses of an example IT neuron (with neuron ID at the bottom left) to the stimuli in (a). Stimuli are sorted in order of increasing response along rows and columns. Each plot consists of a histogram depicting the number of spikes in successive 20-ms bins and raster plots depicting spike times elicited during individual trials across the entire 200-ms image-presentation period.

