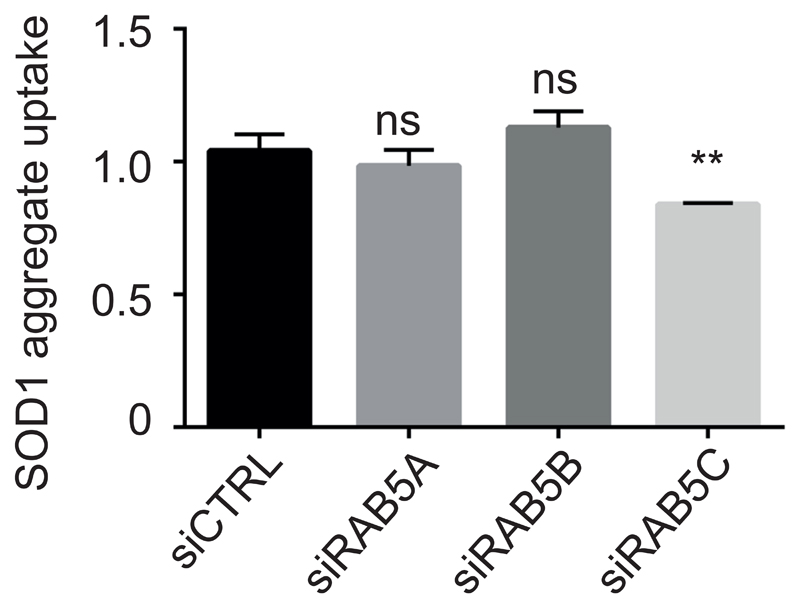
Figure EV6. SOD1 aggregate uptake following RAB5 knockdown.
Flow cytometry analysis of SK-N-AS cells 1 hour after inoculation with 0.8 µM Dylight650-SOD1H46R aggregates and 3 days after transfection with the indicated siRNA. **P≤0.01. Fluorescence intensity of was measured by flow cytometry on 10,000 cells per sample and analyzed by 0rdinary one-way ANOVA followed by multiple comparisons (n≥2).

