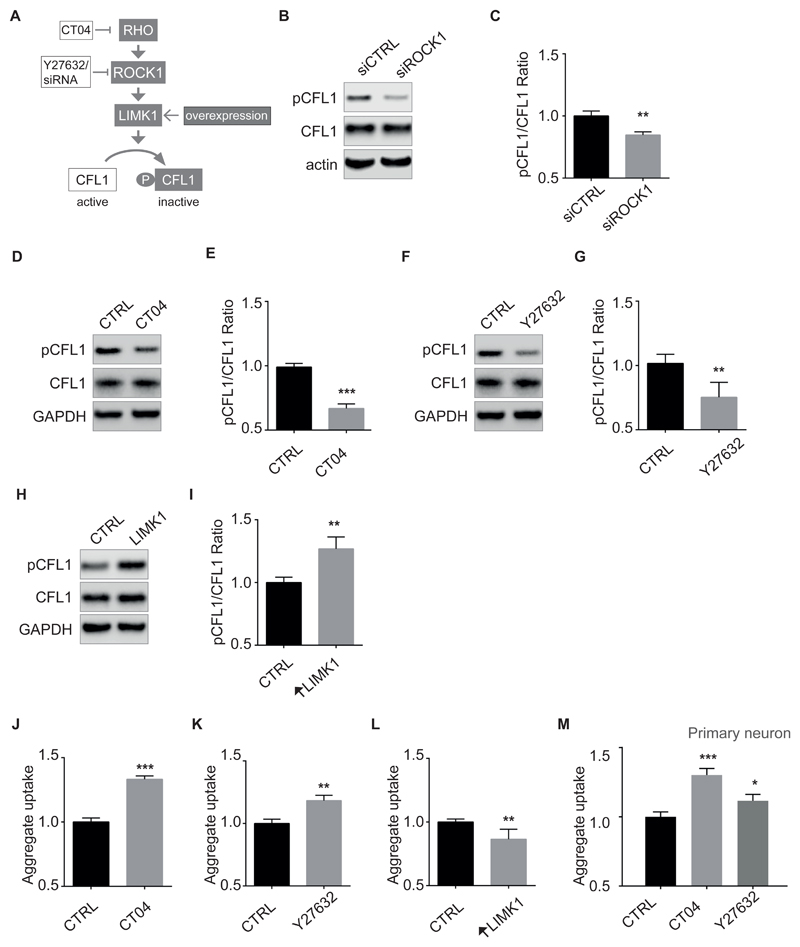
Figure 2. Signaling from RHO to cofilin-1 controls aggregate entry into cells.
A. Cartoon depicting the RHO-ROCK1, LIMK1 signaling pathway to cofilin-1 (CFL1).
B. Immunoblots of the indicated proteins in lysates of SK-N-AS cells 3 days after transfection with ROCK1 siRNA or control siRNA.
C. Quantifications of triplicates of (B). The graph depicts levels of pCFL1 relative to total CFL1 in cells with ROCK1 siRNA knockdown compared with control siRNA treatment. Data are means ± SEM (n = 3). Unpaired t test. Two tailed p = 0.0043.
D. Immunoblots of the indicated proteins in lysates of SK-N-AS cells treated with CT04 or vehicle (CTRL).
E. Quantifications of replicates of (D). Data are means ± SEM (n = 3). Unpaired t test. Two tailed p = 0.0003.
F, G. Same as (D, E) with Y27632. Data are means ± SEM (n = 4). Unpaired t test. Two tailed p = 0.0081.
H. Immunoblots of the indicated proteins in lysates of SK-N-AS cells 2 days after transfection with pTGSH-LIMK1 or empty vector.
I. Quantifications of replicates of (H). Data are means ± SEM (n = 4). Unpaired t test. Two tailed p = 0.0021.
J, K. Flow cytometry analysis of SK-N-AS cells 1 hour after inoculation with 0.8 µM Dylight650-SOD1H46R aggregates and following a 15 hours treatment with 1µg/ml CT04 (J) or 10 µM Y27632 (K) or vehicle (CTRL). Data are means ± SEM (n = 3). Unpaired t test. Two tailed p values are 0.0001 and 0.0097 with treatment of CT04 and Y27632, respectively.
L. Flow cytometry analysis of aggregates uptake in SK-N-AS cells transfected with pTGSH-LIMK1 or empty vector as a control 2 days before inoculation with labelled SOD1 aggregates. Data are means ± SEM (n = 3). Unpaired t test. Two tailed p = 0.0064.
M. Flow cytometry analysis of aggregates uptake 1 hour after inoculation of aggregates in primary neuron in the presence of 1 µg/ml CT04 or 10 µM Y27632 or vehicle (CTRL) added 1 hour before aggregates. Data are means ± SEM (n = 3). Unpaired t test. Two tailed p values are 0.0009 and 0.0254 with treatment of CT04 and Y27632, respectively.
B, D, F, H Representative results are shown. J, K, L, M. Fluorescence intensity of was measured by flow cytometry on 10,000 cells per sample on a LSRFortessaTM (BD Biosciences). *P≤0.05, **P≤0.01. ***P≤0.001.

