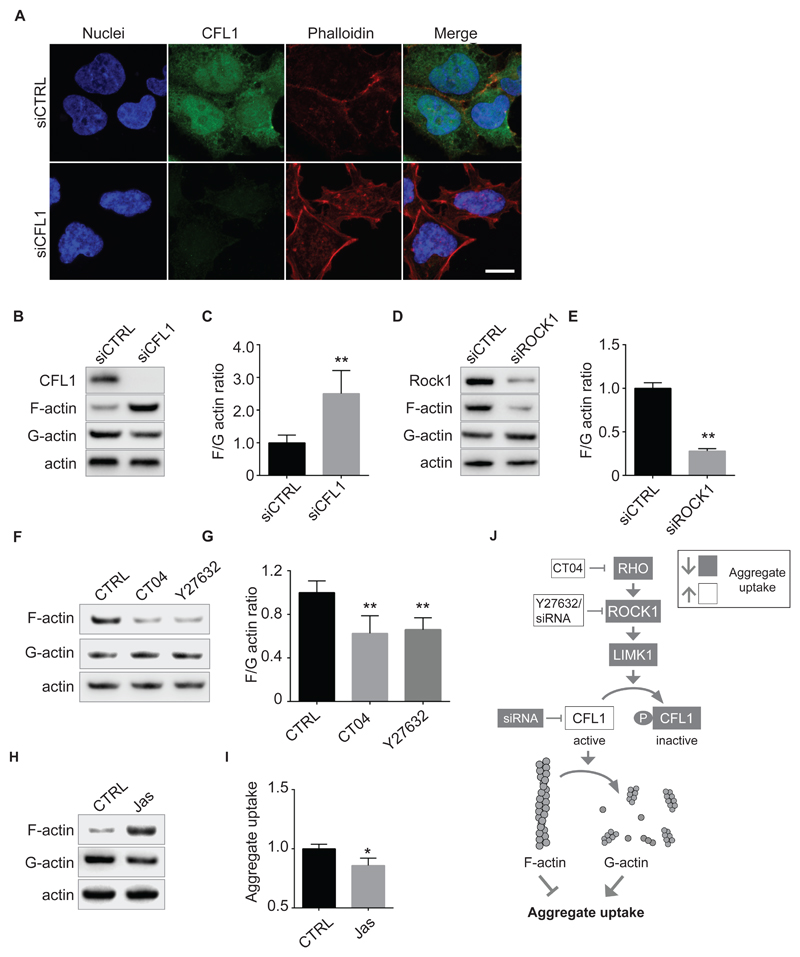
Figure 3. Cofilin-1 controls cortical actin, a barrier to SOD1 aggregates entry.
A. Confocal images of 293T cells 3 days after transfection with cofilin-1 (CFL1) siRNA or control siRNA and stained with H33342 (blue) to reveal nuclei, anti-CFL1 antibody (green) and phalloidin (red) to reveal actin filaments. Scale bar: 10 μM.
B. Fractionation of cell lysates followed by immunoblots to reveal F-actin, G-actin. SK-N-AS cells were transfected with control or CFL1 siRNA 3 days before the analysis.
C. Quantifications of replicates of (B). The graph depicts levels of F-actin/G-actin ratios in cells transfected with or without CFL1 siRNA. Data are means ± SEM (n = 4). Unpaired t test. Two tailed p =0.0068.
D, E. As in (B, C) except that cells were transfected with control or ROCK1 siRNA. Data are means ± SEM (n = 2). Unpaired t test. Two tailed p =0.0046.
F. Fractionation of SK-N-AS cell lysates followed by immunoblots to reveal F-actin, G-actin. Before lysis, cells were treated for 16 hours with 1µg/ml CT04 or 10 µM Y27632.
G. Quantification of replicated experiments as in (F). Data are means ± SEM (n = 4). Unpaired t test. Two tailed p values are 0.0083 and 0.0043 with treatment of CT04 and Y27632, respectively.
H. Immunoblots of F-actin, G-actin and total actin in fractionated lysates from SK-N-AS cells after a treatment with vehicle (DMSO) or 25nM Jasplakinolide for 16 hours.
I. Flow cytometry analysis of aggregates entry, 1 hour after inoculation of SK-N-AS cells with 0.8 µM Dylight650-SOD1H46R aggregates following a treatment with vehicle (DMSO) or 25nM Jasplakinolide for 16 hours. Fluorescence intensity of was measured by flow cytometry on 10,000 cells per sample (n = 2). Data are means ± SEM. Unpaired t test. Two tailed p=0.0155.
J. Cartoon depicting the regulation of acting remodeling by the RHO to CFL1 pathway.
A. B. D. H Representative results are shown. C, E, G, I. *P≤0.05, **P≤0.01.

