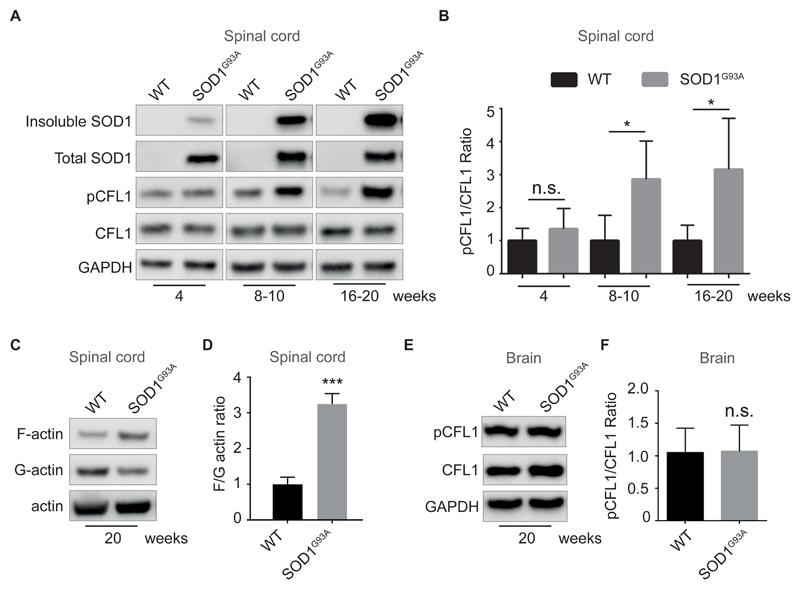
Figure 5. SOD1 aggregates alter cofilin-1 phosphorylation in SOD1G93A transgenic mice.
A. Immunoblots of the indicated proteins in spinal cord lysates of SOD1G93A transgenic mice or wild-type mice from 4 weeks to 20 weeks of age.
B. Quantifications of the pCFL1/CFL1 ratio in immunoblots such as the ones shown in (A). The graph depicts levels of pCFL1 relative to total CFL1 in lumbar region of the spinal cord of SOD1G93A compared with wild-type. Data are means ± SEM (n = 3). Unpaired t test. Two tailed p values are 0.2359, 0.0363 and 0.0376 in each age group separately.
C. Actin fractionation followed by immunoblots of spinal cord lysates from SOD1G93A transgenic or wild-type mice (20 weeks old).
D. Quantifications of the F-actin/G-actin ratios on immunoblots as in (C). The graph depicts the level of F-actin/G-actin ratios in lumbar region of the spinal cord of SOD1G93A compared with wild-type at 20 weeks. Data are means ± SEM (n = 3). Unpaired t test. Two tailed p =0.0004.
E. Immunoblots of the indicated proteins in whole brain lysates of SOD1G93A transgenic or wild-type mice (20 weeks old).
F. Quantifications of the pCFL1/CFL1 ratio on immunoblots as in (E). The graph depicts the level of pCFL1 relative to total CFL1 in brains of SOD1G93A compared with wild-type at 20 weeks. Data are means ± SEM (n = 5). Unpaired t test. Two tailed p =0.8644.
A, C and E. Representative results are shown. B, D and F. n.s.: not significant. P>0.05, *P≤0.05, ***P≤0.001.

