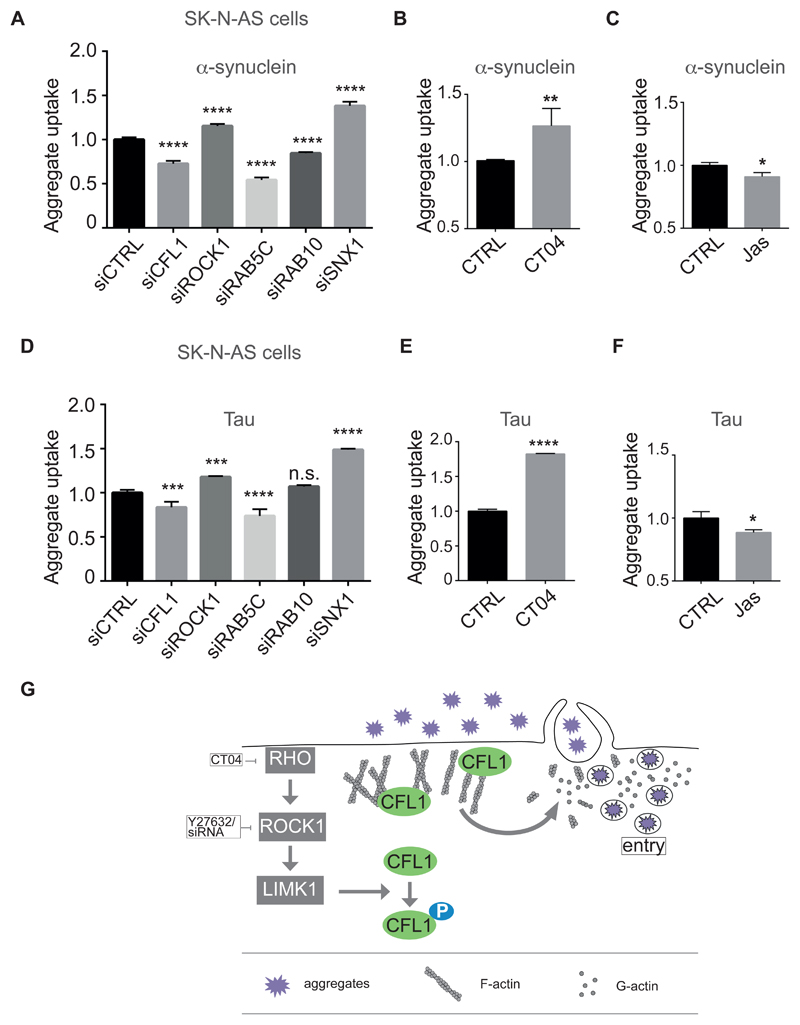
Figure 6. The RHO to cofilin-1 signaling pathway modulates entry of diverse protein aggregates.
A. Flow cytometry analysis of aggregates entry after inoculation of SK-N-AS cells with 0.1 µM Dylight650-α-synuclein aggregates and 3 days after transfection with the indicated siRNA. Fluorescence intensity of was measured by flow cytometry on 10,000 cells per sample (n=3). Ordinary one-way ANOVA followed by multiple comparisons.
B, C. Flow cytometry analysis of α-synuclein aggregates uptake as in (A) except that SK-N-AS cells were treated with 1 µg/ml CT04 (B) or 25 nM Jasplakinolide (C) for 16 hours. Data are means ± SEM (n = 3). Unpaired t test. Two tailed p values are 0.0073 and 0.0159 with treatment of CT04 and Jasplakinolide, respectively.
D. Flow cytometry analysis of SK-N-AS cells after inoculation with 0.06 µM Dylight650- tau aggregates and 3 days after transfection with the indicated siRNA. Fluorescence intensity of was measured by flow cytometry on 10,000 cells per sample (n=3). Ordinary one-way ANOVA followed by multiple comparisons.
E, F. Same as in (B and C) with tau aggregates. Data are means ± SEM. (n≥3). *P≤0.05, ** P≤0.01, *** P≤0.001, ***P≤0.0001. Representative results are shown. Data are means ± SEM (n = 3). Unpaired t test. Two tailed p values are 0.0001 and 0.0232 with treatment of CT04 and Jasplakinolide, respectively.
G. The Rho to cofilin-1 signaling pathway is exploited by protein aggregates to remodel to cortical actin, enabling cell entry.
A-F Fluorescence intensity of was measured by flow cytometry on 10,000 cells per sample on a LSRFortessaTM (BD Biosciences). *P≤0.05, ** P≤0.01, *** P≤0.001, ***P≤0.0001.

