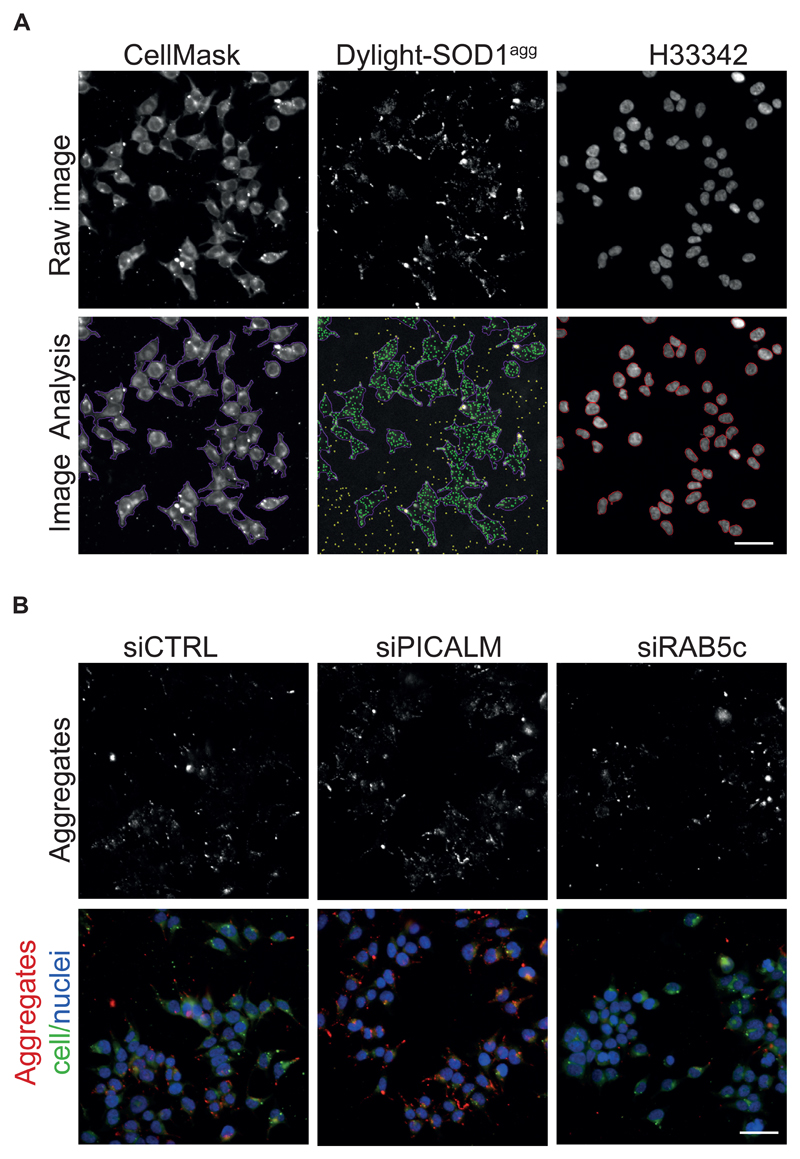
Figure EV1. Representative images of the siRNA screen.
A. Representative primary image samples extracted from the siRNA screen with the Nikon high content microscope (20x 0.75 NA objective). Upper row: Sub-region taken from a three-channel image of 293T cells treated for 16 hours with Dylight-650 labelled SOD1 aggregates. The sample was co-stained with H33342 (blue) to reveal nuclei and CellMask (green) to reveal plasma membrane. Lower row: results of image segmentation using the Nikon NIS elements general analysis. Aggregates within cells are identified as green dots. CellMask reveals the outline of the plasma membrane artificially coloured as purple boundary. Yellow dots are rejected spots, being either aggregates outside of cells or containing saturated pixels. Red circle lines delineate the cell nuclei. Scale bar: 50 μm.
B. High content images of 293T cells 3 days after transfection with control (CTRL) siRNA, PCALM siRNA or RAB5C siRNA and stained with H33342 (blue) to reveal nuclei, CellMask green plasma membrane stain (green). Cells were fixed and imaged after 16 hours flowing inoculation with Dylight-650labelled SOD1 aggregates (red). Scale bar: 50 μm.

