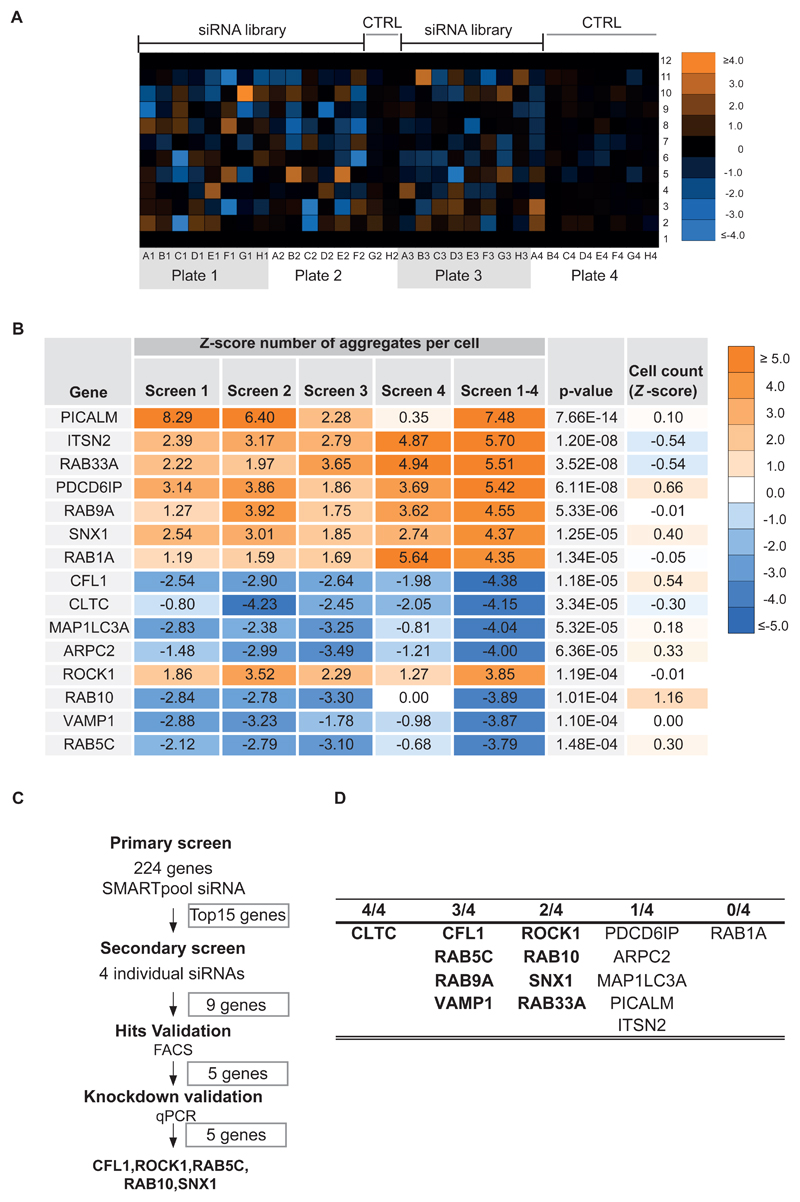
Figure EV2. Overview of siRNA screen procedure.
A. Upper panel: Color matrix representing the combined Z-score (protein aggregates per cell normalized to control) for each siRNA knockdown reconstructed at original well-plate grid locations.
B. Summary of siRNA screening results for the top 15 genes. Hits are ranked according to the absolute value of the combined Z-scores (screen1-4), normalized from average of experimental replicates (screen 1, screen 2, screen 3 and screen 4). P value is the estimated probability of obtaining a value as combined Z-scores; the cell count corresponds to the mean of cell count Z-scores from four independent biological experiments.
C. Overview of the validation strategy of siRNA screen.
D. Number of individual siRNA (out of 4) per hit modifying SOD1 aggregate entry in secondary screen.

