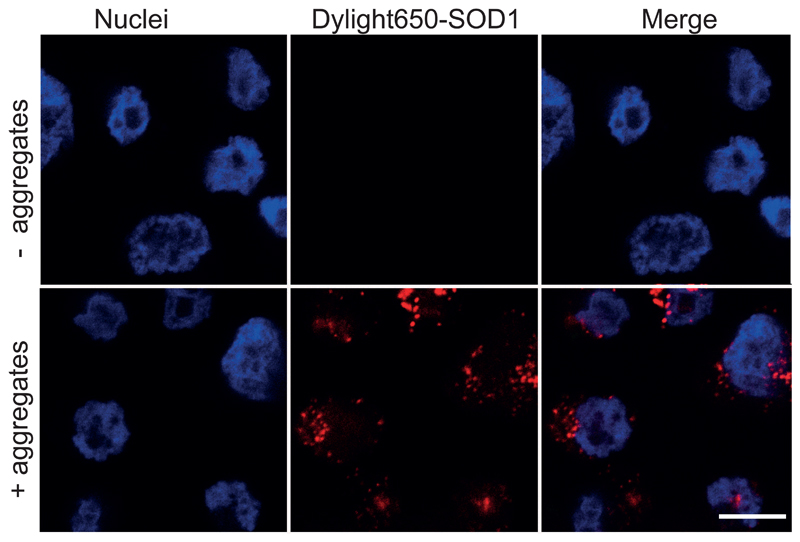
Figure EV3. Confocal images showing SOD1 aggregates are inside cells after trypsinization and prior to FACS analysis.
SK-N-AS cells were trypsinized and fixed after 2 hours following inoculation with Dylight-650 labelled SOD1 aggregates. Images were acquired with the Zeiss 710 confocal microscope (Carl Zeiss Ltd.) by 63X objective focusing on nuclei layer, to ensure that the images enable the visualization of the cellular content. Scale bar: 10 micrometers.

