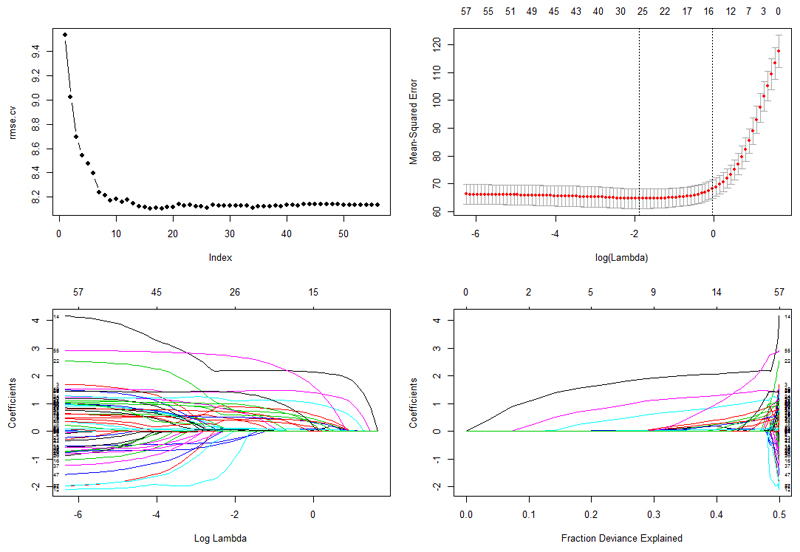
Figure 3. Explanatory plots for cross-validated errors and Lasso coefficients.
Explanatory plots for cross-validated errors and Lasso coefficients (all participants n=1749). The first plot (top left) demonstrates the cross-validated root mean squared error (rmse.cv) as a function of number of variables included in the linear regression model. The plot demonstrates that adding more than ~16 variables in the model does not necessarily improve the model in terms of RMSE reduction. The second plot (top right) demonstrates the 10-fold cross-validated mean squared error as a function of (log) lambda (λ) for the lasso regularized model using the full data with interaction terms. The top numbering of the plot indicates the number of predictors (variables) the model is using, going from all predictors (top left corner) to more sparse models (top right corner). This function helps the optimization of Lasso in terms of choosing the best λ. The third plot (bottom left) shows the predictors coefficients scores as a function of log(λ) indicating the shrinkage of coefficients for larger numbers of log(λ). The top numbering of the plot indicates the number of predictors (variables) the model is using, going from all predictors (top left corner) to more sparse models (top right corner). The last plot (bottom right) shows the fraction of deviance explained by the models in relation to the number of predictors used and their coefficients. Each coloured line described a single predictor and its coefficient score. The plot shows that close to the maximum fraction of deviance explained larger coefficients occur indicating likely over-fitting of the model. (color print, two-column fitting image)

