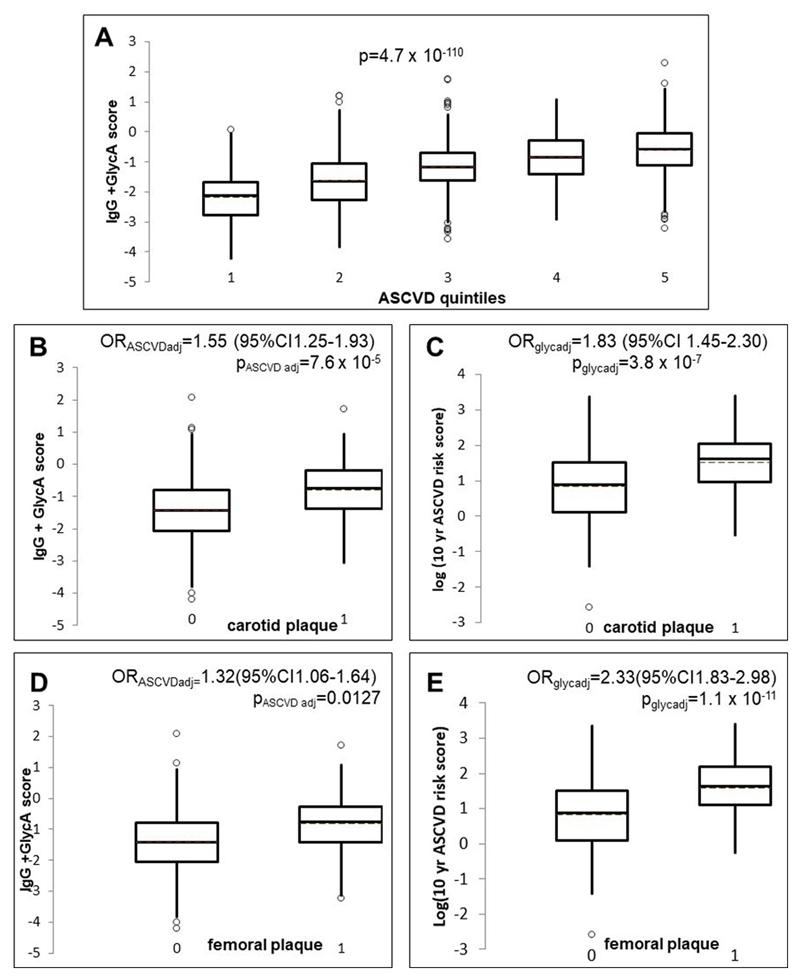
Figure 4.
(A) Box plot showing the distribution of the glycan score in quintiles of the 10-year ASCVD risks core. (B) Box plot showing the distribution of the glycan (IgG +GlycA) score in individuals with and without carotid plaque. P-values and odds ratios (OR) from logistic regression adjusted for log (10-year ASCVD risk score) (C) Box plot showing the distribution of the log (10-yearASCVD risk score) in individuals with and without carotid plaque, OR and p-value adjusted for glycan score (D) Box plot showing the distribution of the glycan score in individuals with and without femoral plaque. P-value and OR adjusted for log (10-year ASCVD risk score) (E) Box plot showing the distribution of the log (10-year ASCVD risk score) in individuals with and without femoral plaque, OR and p-value adjusted for glycan score.

