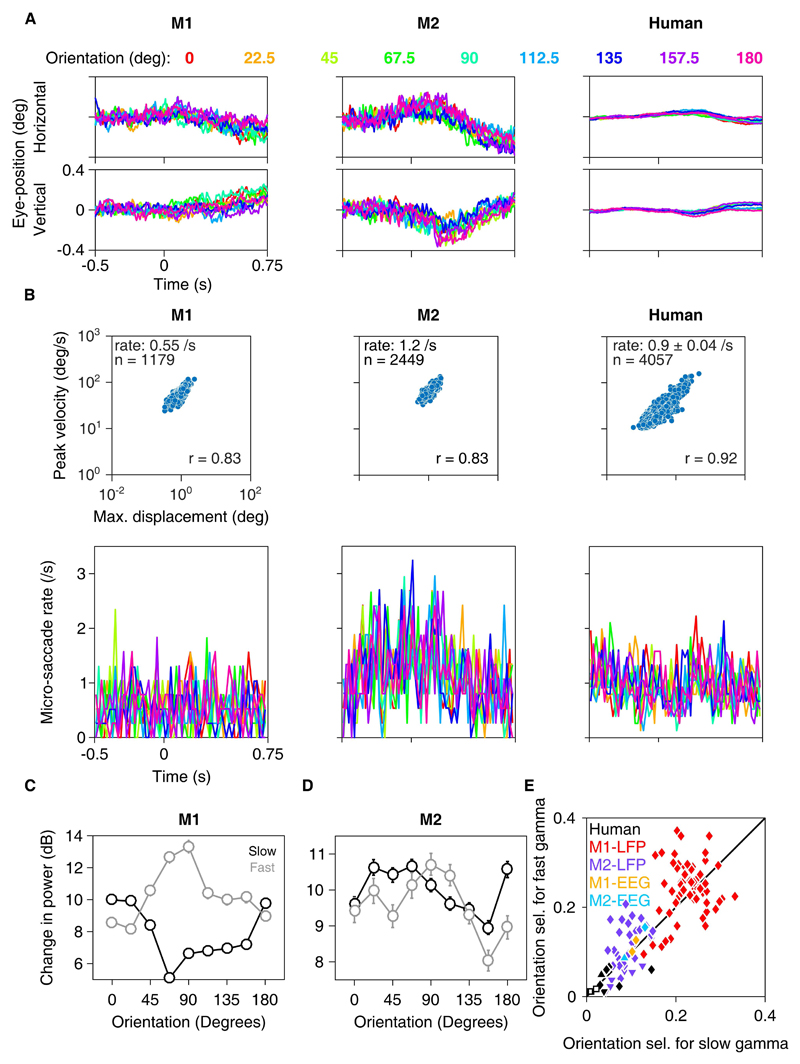
Figure 2-2. Analysis of eye-position and microsaccades for orientation-tuning experiment.
(A) Mean eye-position for monkey 1 (left plots), monkey 2 (centre) and humans (right) along the horizontal (top row) and vertical (bottom row) directions between -0.5 – 0.75 s of stimulus onset for all 9 orientations, at spatial frequency of 2 cpd for monkeys. For humans, average across 12 subjects is presented. (B) Main-sequence plots for the two monkeys and humans are presented in the top row, and histograms showing microsaccade-rate during the interval between -0.5 – 0.75 s of stimulus onset are presented in the bottom row. Data for monkeys is pooled across all spatial frequencies for maximizing the microsaccades being detected; similar results are obtained if analysis is restricted to 2 cpd. Microsaccade-rate (mean for each monkey and mean ± SEM across 12 humans), number of microsaccades (n) and correlation-coefficient (r) is indicated in the main-sequence plots. (C-D) Orientation-tuning curves for Monkeys 1 (C) and 2 (D) respectively, estimated after removing trials containing microsaccades (at least one microsaccade during the analysis period of -0.5 – 0.75 s). (E) Orientation selectivity for slow and fast gamma for the two monkeys and 11 humans calculated after removing microsaccade-containing trials. Same format as in Figure 2E.

