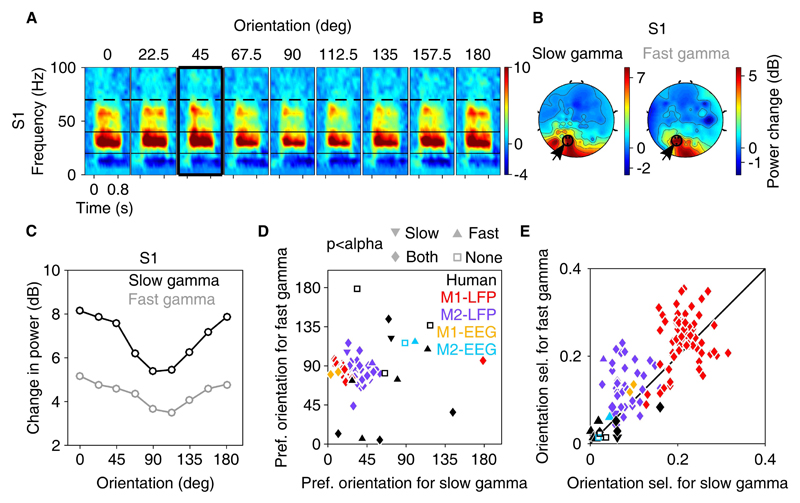
Figure 2. Slow and fast gamma oscillations in human EEG.
(A) Change in time-frequency power spectrum from baseline (-0.5-0s) for an example subject (S1). Power is averaged across three bipolar pairs in the left occipital and parietal area, shown as black dots (encircled and pointed by an arrow) in panel B. (B) Scalp maps for slow and fast gamma ranges for stimulus orientation of 45° (highlighted with a black box in panel A). Similar time-frequency difference spectra and scalp maps for the rest of the subjects is shown in Figure 2-1. (C) Change in power from baseline for 9 orientations for Subject 1. (D) Preferred orientations and (E) Orientation selectivity for slow and fast gamma rhythms for 12 human subjects, monkey EEG (2 sites per monkey) and monkey LFP (65 and 34 sites). Different symbols in panels D and E indicate statistical significance for orientation selectivity (calculated from original data) compared against randomly permuted data (see Statistical analysis section in Materials and Methods for details) for slow and fast gamma (as indicated above panel D). Significance level (α) is Bonferroni corrected (from 0.05) for number of human subjects or electrodes (for monkeys). Figure 2-2 shows results for orientation tuning after data containing microsaccades is discarded from analysis.

