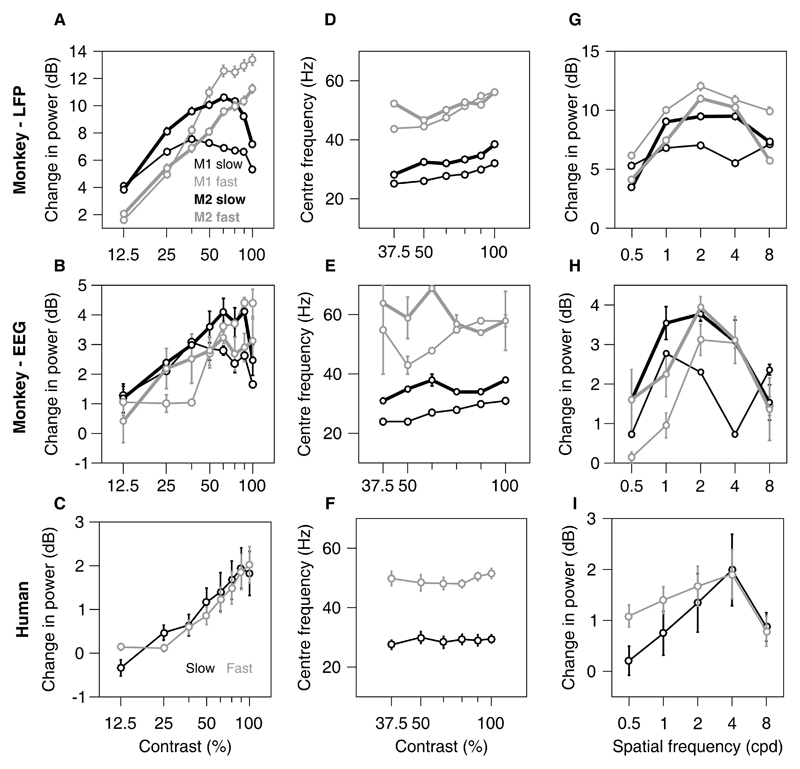
Figure 3. Tuning for contrast and spatial frequency.
(A) Mean change in power for two gamma bands as a function of stimulus contrast for 65 and 36 sites for the two monkeys (top row), calculated at stimulus orientations that induced largest power change in fast gamma (90° for both monkeys) and slow gamma (0° and 45°). B) Same as A, for 2 EEG electrodes for each of the two monkeys. C) Mean change in power for 12 human subjects, computed for a stimulus orientation that induced robust gamma in both bands (shown in a thick black box in Figure 2A and Figure 2-1). (D-F) Mean peak gamma frequency in slow and fast bands. Same format as in A-C. (G-I) Spatial frequency tuning for 65 and 34 sites in the two monkeys (G), 2 EEG electrodes each for the two monkeys (H) and 12 human subjects (I). Figure 3-1 shows change in power spectra for contrast and spatial frequency tuning experiments.

