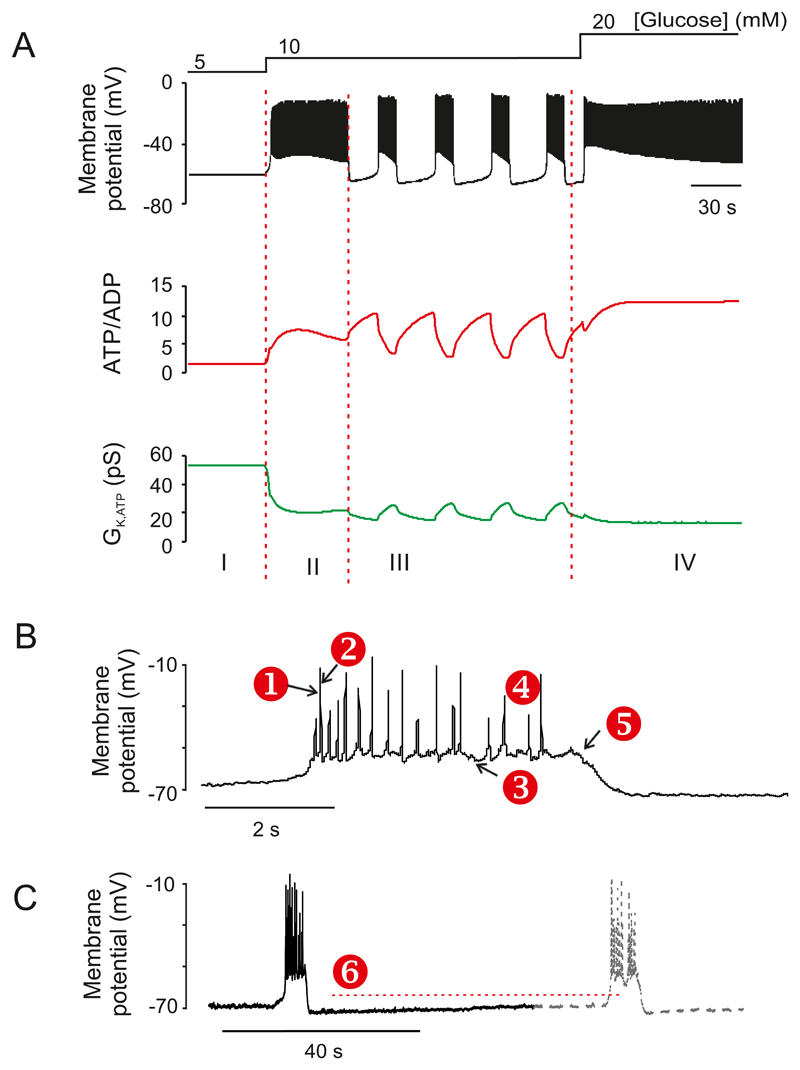
Figure 12.
A: Schematic of the effects of increasing glucose concentrations (indicated top) on mouse β-cell membrane potential and electrical activity, ATP/ADP ratio and whole-cell KATP channel conductance (GKATP). The dashed vertical lines separate phase I, II, III and IV (see main text). Schematic based on (112, 113). Schematic courtesy of Dr C Cha, Oxford. B-C: Bursts of β-cell action potentials recorded from a β-cell exposed to 10 mM glucose. The numbers ➊-➏ highlight different phases of β-cell electrical activity: ➊ the upstroke of the action potential; ➋ action potential repolarization; ➌ the plateau potential; ➍ the progressive decrease in action potential amplitude during the burst; ➎ burst termination; and ➏ the pacemaker depolarization between two successive bursts. See Section VIII.A.

