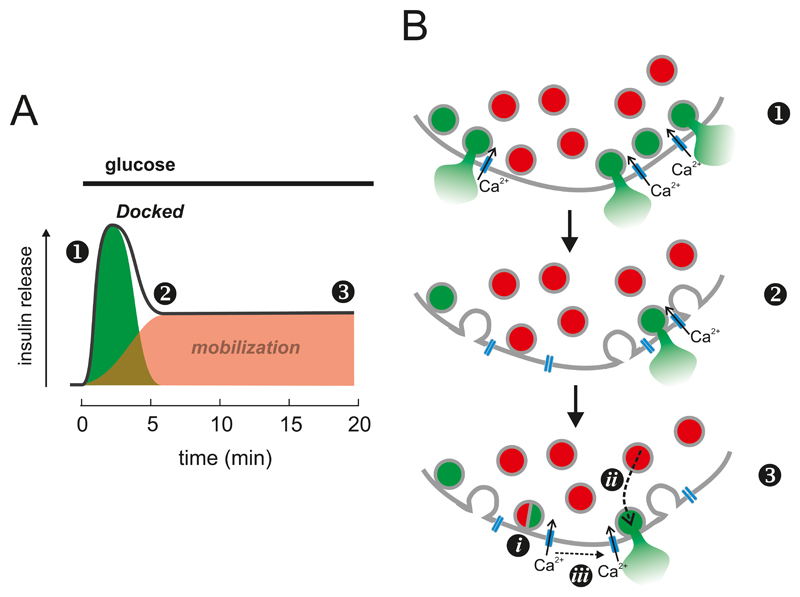
Figure 24.
A: Schematic of glucose-induced biphasic insulin secretion. The numbers ➊,➋ and ➌ indicate the onset of 1st phase secretion, the end of 1st phase secretion and steady-state 2nd phase insulin secretion, respectively. The green and red areas correspond to the release of docked granules and mobilization of granules, respectively. B: At the onset of 1st phase insulin secretion (➊), exocytosis principally involves docked granules situated close to voltage-gated Ca2+ channels. The depletion of this granule pool, together with inactivation of voltage-gated Ca2+ channels (from 3 to 1 in the schematic, indicated by the lack of arrows through Ca2+ channels), account for the transient nature of 1st phase insulin secretion (➋). 2nd phase insulin secretion (➌) involves the priming of granules already docked with the plasma membrane but that had previously not acquired release competence (going from red to green: i), physical translocation of granules from within the β-cell (ii) and redistribution of the voltage-gated Ca2+ channels within the plasma membrane (iii).

