Figure 25.
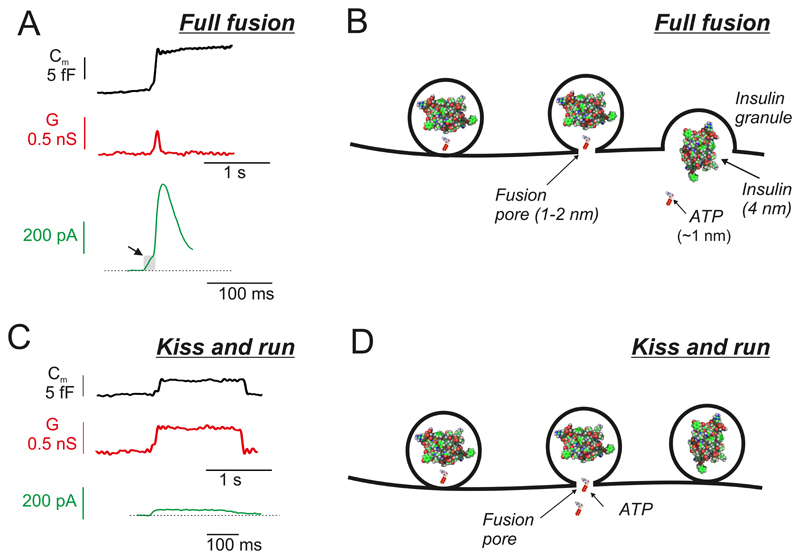
A: Single-vesicle capacitance increases (Cm, black trace), fusion pore conductance changes (G, red trace) and patch-clamp measurements of ATP release (green trace). Exocytosis leads to a step increase in membrane capacitance of 4-8 fF and a transient increase in G that reflects the initial opening of the fusion pore. In measurements of ATP release, activation of the purinergic receptors results in a membrane current that can be recorded using the whole-cell patch-clamp technique. For display, the current responses have been inverted. Arrow indicates the pedestal. B: Schematic of full fusion. The fusion pore is initially large enough to accommodate ATP but not bulkier molecules (like insulin). Release of ATP via the fusion pore gives rise to a pedestal (arrow in A), whereas the main spike reflects full fusion and emptying of the entire cargo. ATP and insulin are shown as space-filling models and are inserted to scale. The width of the fusion pore is also to scale but not the dimensions of the rest of the granule (300 nm vs. <2 nm for initial diameter of the fusion pore). C: As in A but measurements obtained during ‘kiss-and-run’ exocytosis. In kiss-and-run exocytosis, the increase in capacitance is only transient and is associated with a maintained (for the duration of the capacitance increase) increase in fusion pore conductance. The persistence of the increased fusion pore conductance indicates the failure of the fusion pore to expand. During kiss-and-run exocytosis, a more sustained but lower amplitude ATP-activated current is observed. D: As in B but showing kiss-and-run exocytosis. Slow release of ATP via the fusion pore results in the sustained but smaller ATP-activated current in C. Insulin remains trapped inside the granule lumen. Thus, the fusion pore may function as a molecular sieve.

