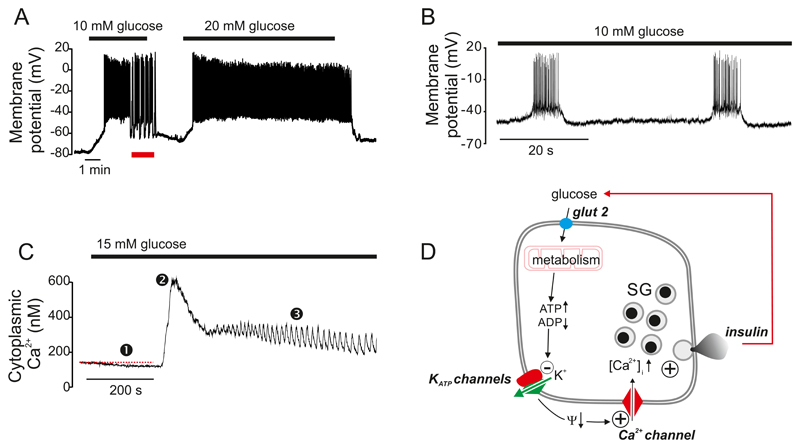
Figure 5.
A: Glucose induced electrical activity recorded from a β-cell in an acutely isolated intact mouse islet when the glucose concentration was increased from 1 to 10 or 20 mM (as indicated by horizontal bars). Note that 10 mM glucose evokes a biphasic response and that continuous action potential firing is replaced by oscillatory (bursting) electrical activity after the initial 3-4 min (red horizontal line beneath the membrane potential recording). At 20 mM glucose, electrical activity is continuous and there is a time-dependent ~15 mV reduction in the amplitude of the action potentials (Recording provided by Dr Q Zhang, Oxford). B: Bursts of action potentials in a β-cell in a freshly isolated mouse islet exposed to 10 mM glucose shown on an expanded time base. C: Changes in cytoplasmic free Ca2+ ([Ca2+]i) in response to a step increase in glucose from 1 to 15 mM glucose. Note the triphasic response to glucose: ➊ an initial lowering below basal [Ca2+]i (red dashed line), a rapid increase to a peak ➋ followed by a decline to an elevated plateau on which small oscillations are superimposed ➌. D: ‘The consensus model of GIIS’. Abbreviations used: glut2, glucose transporter; KATP channels, ATP-sensitive K+ channels; Ψ, membrane potential; SG, secretory granules. The + and – signs denote stimulation and inhibition, respectively, whereas the arrows (↑,↓) indicate an increase or decrease of the indicated parameter. The red arrow connecting ‘insulin’ and ‘glucose’ indicates feedback regulation of insulin secretion via changes in plasma glucose.

