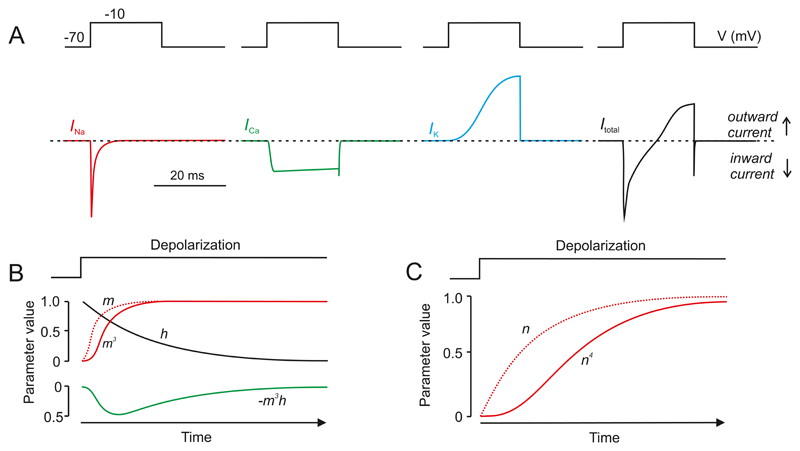
Figure 8.
A: Schematic of voltage-gated Na+ current (INa; red), Ca2+ current (ICa; green), delayed rectifying K+ current (IK; blue) and total membrane current (Itotal, i.e. INa + ICa + IK; black) elicited by a voltage-clamp depolarization (V) from -70 mV to -10 mV. The dashed line indicates the zero-current level. Downward and upward deflections represent inward (depolarizing) and outward (repolarizing) membrane currents, respectively. B: Time-dependent changes in the value of m (dotted red), m3 (continuous red) and h (grey) where m and h vary with time after the onset of depolarization (t) according to the expressions m(t) = m∞ * (1-exp[-t/τm]) and h(t) = h0 * exp(-t/τh). The parameter values for m and h have been normalized to their maximum. The green trace (below) shows the product m3h, which approximates the activation and inactivation of the whole-cell Na+ current. The curve has been inverted in order to facilitate comparison with the Na+ current. C: Time-dependent changes in values of n and n4 where n varies with time after onset of depolarization (t) according to the expression n(t) =n∞*(1-exp[t/τn]). This approximates the time course of the whole-cell K+ current. Note that m3 and n4 result in sigmoidal activation kinetics. Modified from (282).

