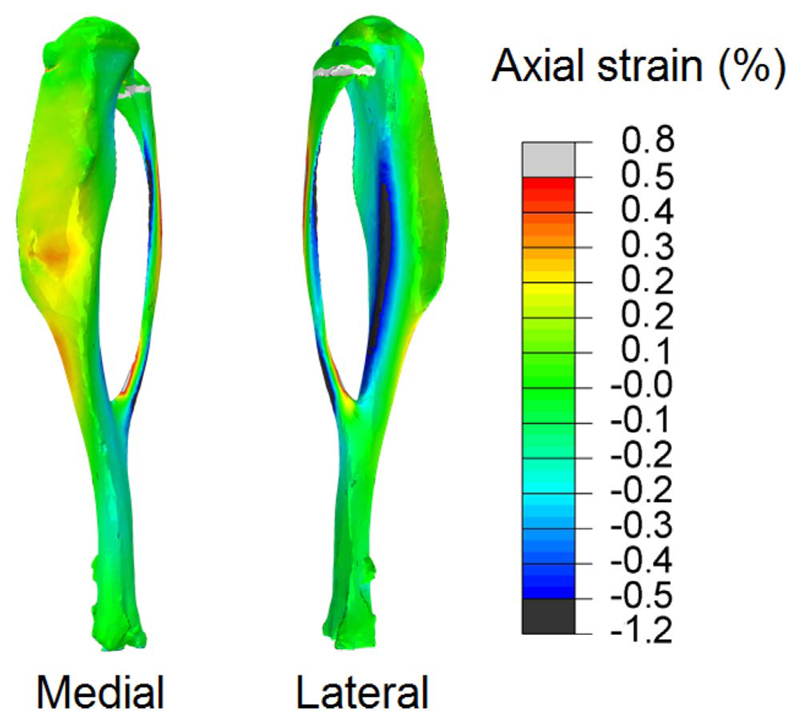
Fig. 6.
The strain map on the bone surface at 12 N of load assessed using a finite element model of a representative control 22 w.o. mouse tibia bone, with homogeneous isotropic material properties, have similar distribution as the strain obtained experimentally using DIC (Fig. 2A).

