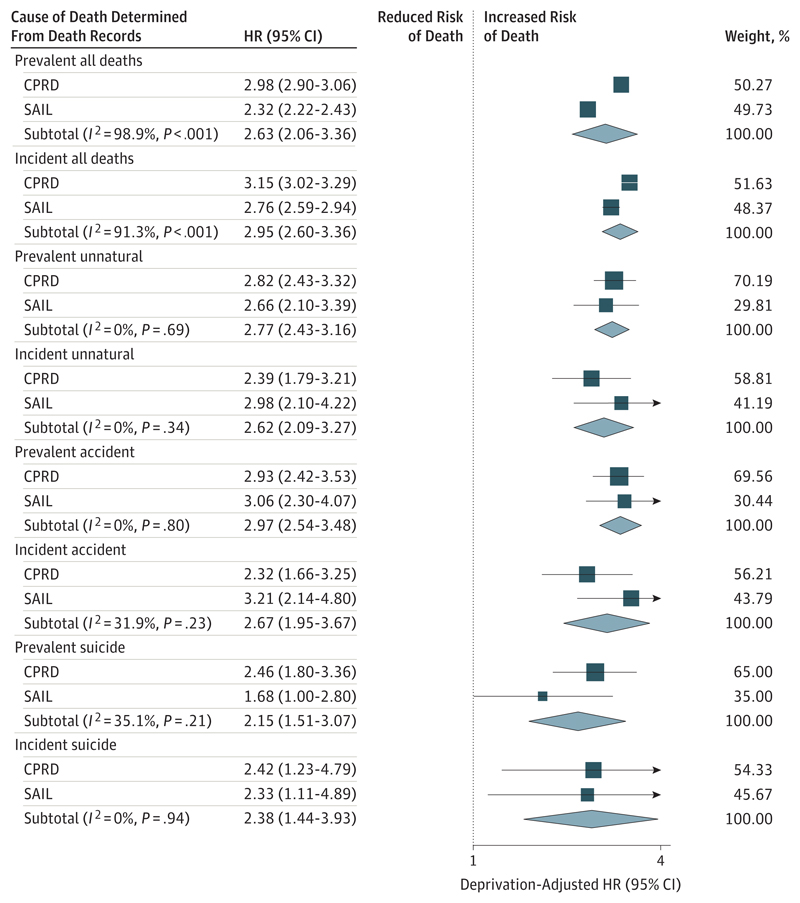
Figure 3. Forest Plot Showing Deprivation-Adjusted Hazard Ratios (HRs) Estimated From Prevalent and Incident Epilepsy Cohorts.
Deprivation-adjusted HRs for all deaths, unnatural deaths, unintentional deaths, and suicides are shown for prevalent and incident epilepsy cohorts vs comparison cohorts. The HRs were estimated separately using the Secure Anonymised Information Linkage (SAIL) Databank and the Clinical Practice Research Datalink (CPRD) database, and meta-analyses were conducted using DerSimonian and Laird random-effects models. Weights are from random-effects analysis. Cause of death was determined from the Office for National Statistics–recorded underlying cause of death as classified using International Statistical Classification of Diseases and Related Health Problems, Tenth Revision codes.

