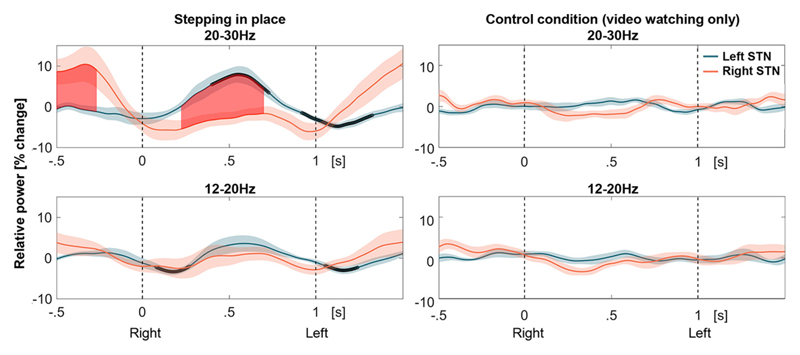
Figure 4.
High- and low-beta power modulation. The data are aligned to all right heel strikes (at 0 s), followed by left heel strikes on average 1 s afterward. Black bold lines denote significant differences to 0 and the red filled area shows significant differences between 20 and 30 Hz beta power in the left and right STN after cluster-based multiple-comparison correction (top row; n = 12 patients). The significant differences between the left and right STN appeared when one foot is resting on the floor while the other is up in the air. Shaded areas denote SEM. No significant modulation was present when patients were not moving but were watching the video (right column).

