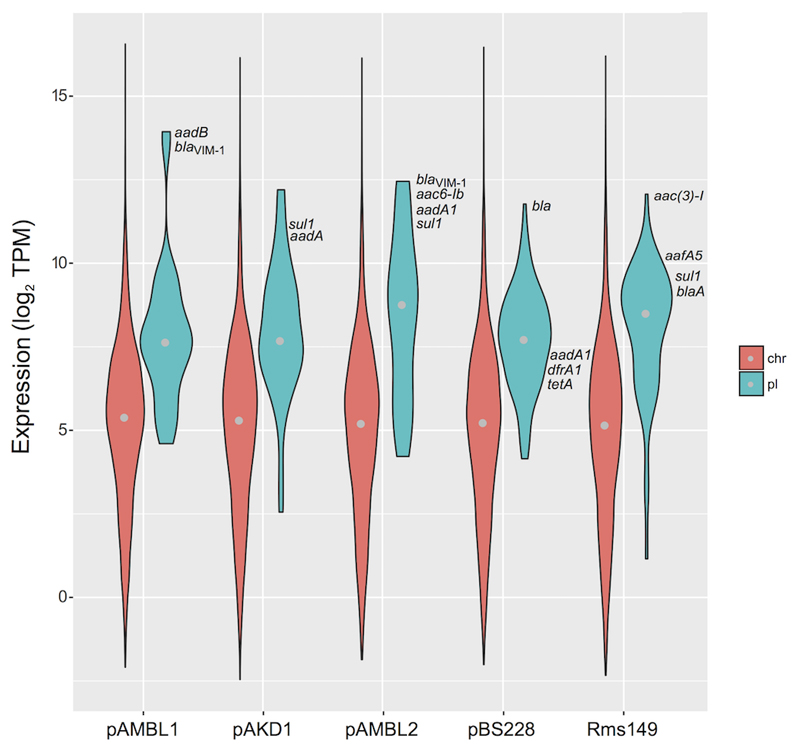
Figure 2. Plasmid genes are highly expressed.
Plasmid-encoded genes showed a higher level of expression than chromosome-encoded genes. Violin plot representing the distribution of transcript abundances (in log2 of transcripts per million, TPM) of chromosome (red) and plasmid (blue) genes in each plasmid-carrying PAO1. The grey dot represents the median values of the distributions. For clarity, we removed non-expressed chromosomal and plasmid genes in this figure (see main text for statistical analyses including and excluding non-expressed genes and correcting for plasmid copy numbers). Plasmid-encoded antibiotic resistance genes are depicted in the figure according to their level of expression. Note that antibiotic resistance genes are, in general, among the plasmid genes with highest level of expression.

