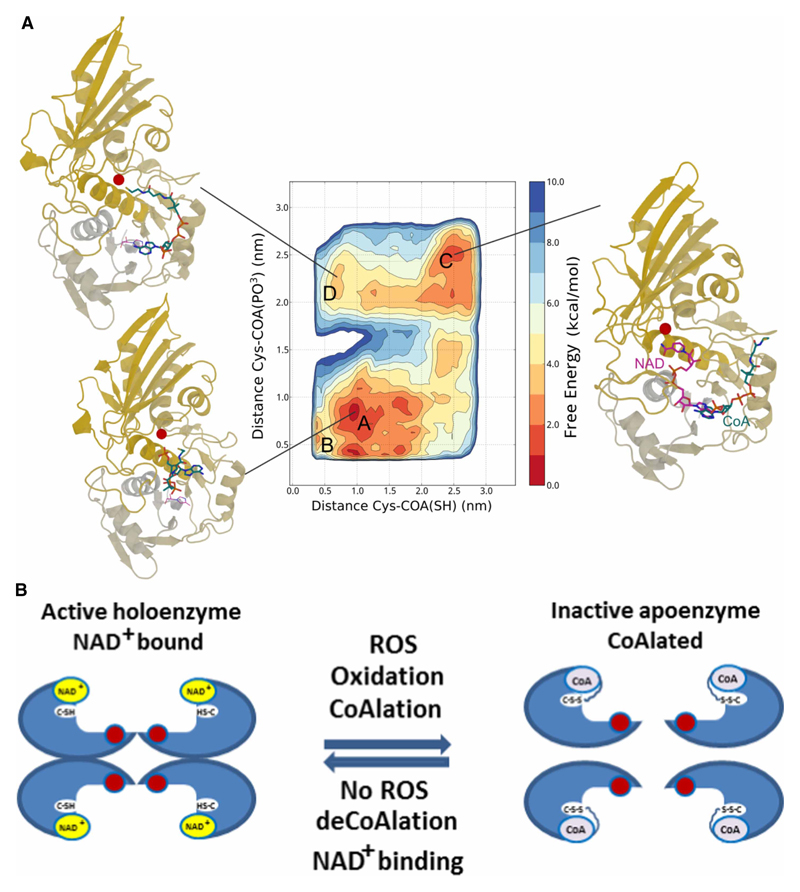
Figure 7. The mode of interaction between SaGAPDH and CoA.
(A) Free energy landscape of the CoA : GAPDH complex as a function of the distance between Cys151 (shown as a red ball in the exemplary structures) and the CoA SH tail (x-axis) and the PO3 group attached to the sugar moiety (y-axis). The contour lines are drawn every 2 kcal/mol. CoA and, for reference, NAD are shown in blue and magenta sticks, respectively. The computed free energy landscape reveals how CoA can assume different conformations, folded onto itself (labeled as A in the map) near the nicotinamide-binding site (as shown in the corresponding figure on the lower left corner), or binding the adenine-binding site (MD-B). The CoA tail can approach Cys151 from both these minima or by assuming the conformations found in basin MD-D (top left corner) when starting from the extended conformation observed in basin MD-C (top right corner). The latter basins are slightly higher energy when compared with the absolute minimum, but still accessible. (B) A proposed model of CoA binding to SaGAPDH, where CoA binds to the nicotinamide-binding site and its tail approaches Cys151 forming a covalent bond.

