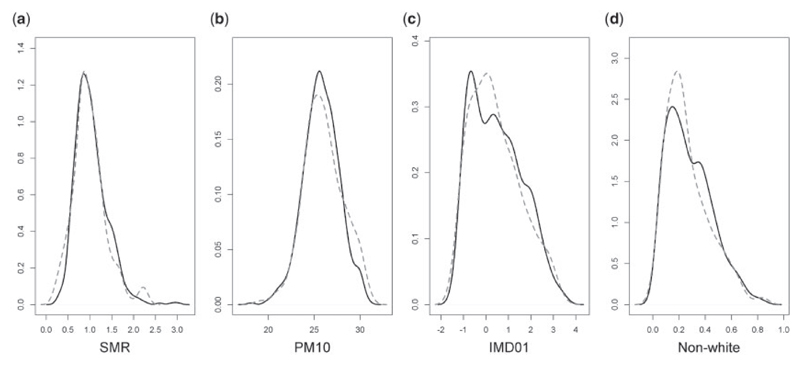
Fig. 3.
Comparison of wards covered/not covered by HSfE. The four density plots represent the distribution of the following variables across wards (from left to right): (a) SMR=O/E; (b) PM10, included as a continuous variable (μg/m3); (c) IMD01, the Carstairs index at 2001; (d) Proportion of non-white individuals. The solid lines are the distributions in the wards with ≥5 individuals sampled by HSfE, while the dashed line the distributions for the wards with <5 individuals sampled by HSfE or not covered by HSfE. A similar behavior can be seen for all the variables across wards.

