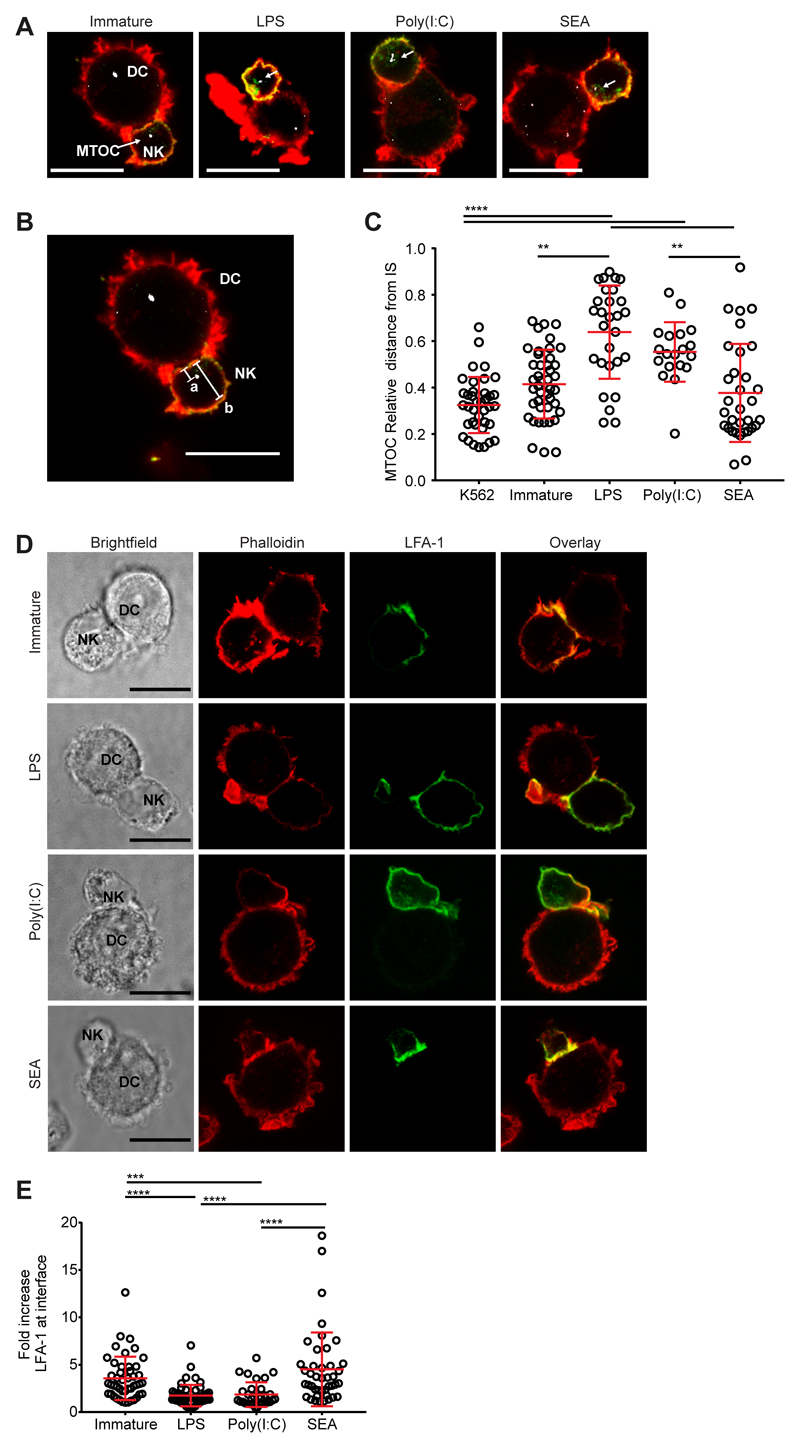
Figure 3. NK cells show MTOC and LFA-1 reorganisation in conjugates with DCs treated with SEA.
(A) Panels show autologous NK cells conjugated with immature DCs (left) or DCs treated for 24 h with LPS, Poly(I:C) or SEA, overlays of cells stained with phalloidin (red), anti-NKp30 mAb (green) and anti-pericentrin polyclonal antibody (white). Representative data from >150 images taken over 3 independent experiments; scale bars 10 μm. (B) Example of MTOC distance measurement with image from panel A, distance from MTOC to cell-cell interface (labelled a) is divided by the diameter of the NK cell (labelled b). (C) Relative distance of the NK cell MTOC from immune synapse in conjugates with K562 target cells, immature DCs or DCs treated for 24 h with LPS, Poly(I:C) or SEA. (D) Panels show images of autologous NK cells conjugated with immature DCs or DCs treated for 24 h with LPS, Poly(I:C) or SEA DC-NK stained with phalloidin (2nd column, red) and anti-LFA-1 mAb (3rd column, green). A brightfield image (left) and overlay of the two channels (right, yellow shows co-localisation) are shown. Images representative of >150 images taken across 3 independent experiments; scale bars 10 μm. (E) Fold increase in fluorescence intensity of staining with anti-LFA-1 mAb at the cell interface, compared to the back of the NK cell, in conjugates with immature DC and DC treated for 24 h with LPS, Poly(I:C) or SEA. In all plots circles represent data points from individual cell contacts pooled from 3 independent donors, lines show mean (± standard deviation). *p<0.05, ** p<0.01, ***p<0.001, analysed by Kruskal wallis test with Dunn’s multiple comparisons.

