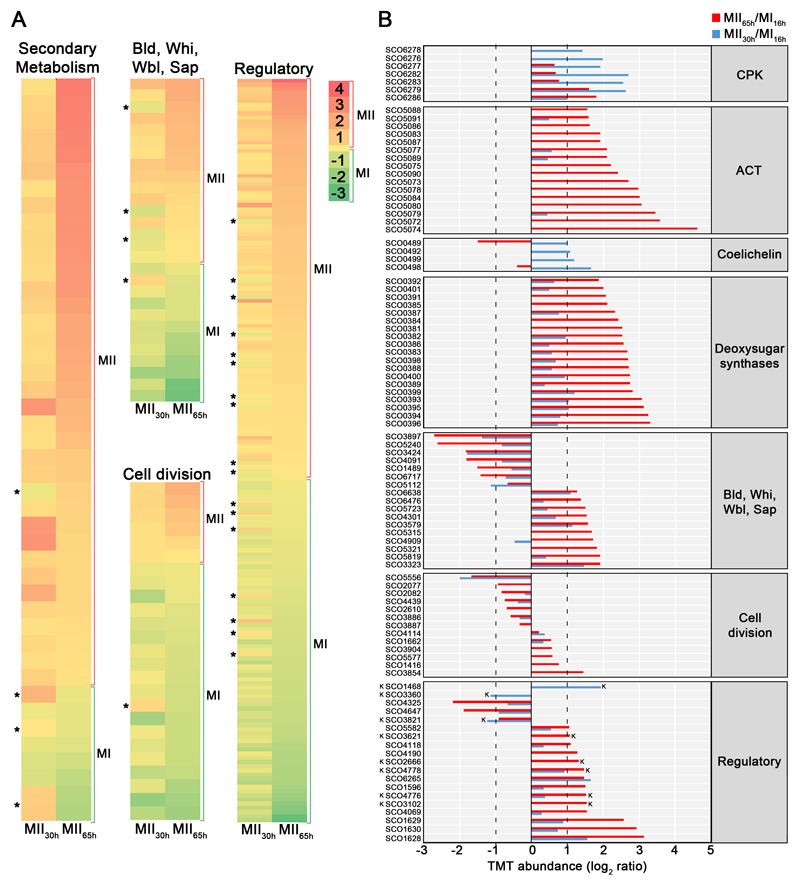
Fig. 4. Abundances (logarithm of TMT MII/MI) of proteins related with secondary metabolism, aerial mycelium formation, sporulation, cell division and regulation of cellular processes (transcriptional regulators, transducers Ser/Thr/Tyr kinases and signalling proteins).
Proteins involved in the synthesis of specific secondary metabolites, were classified in the secondary metabolism group, even if they fitted additional categories; proteins involved in cell division regulation, were included in cell division (see Methods). A, Heat maps outlining the TMT abundances of proteins with significant variations in both MII stages with respect to MI. Asterisks indicate the few proteins showing opposite differences in both MII (i.e. up-regulated at MII30h and down-regulated at MII65h or vice versa). B, TMT abundances of the key proteins described in the text. Abundances have significant differences (q-value < 0.01) and passed the 2-fold threshold in at least one of the MII stages, except for cell division proteins, in which proteins below the 2-fold threshold, but showing significant differences, are also shown. The SCO numbers are indicated. Dashed lines indicate the 2-fold threshold. “K” indicates Ser/Thr/Tyr kinases.

