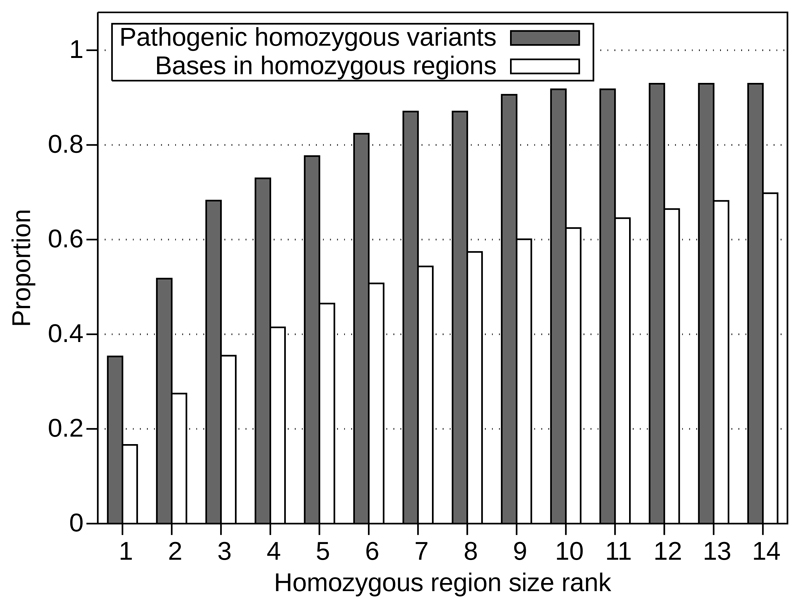
Figure 2.
Rank, size and relative size have predictive power. The ROC curve for our combined dataset (discovery cohort plus replication cohorts, excluding samples with homozygosity >8% and variants within 3Mb of a telomere) demonstrates that there is positive predictive value for each of rank, size and relative size, with the highest predictive value coming when these are combined.

