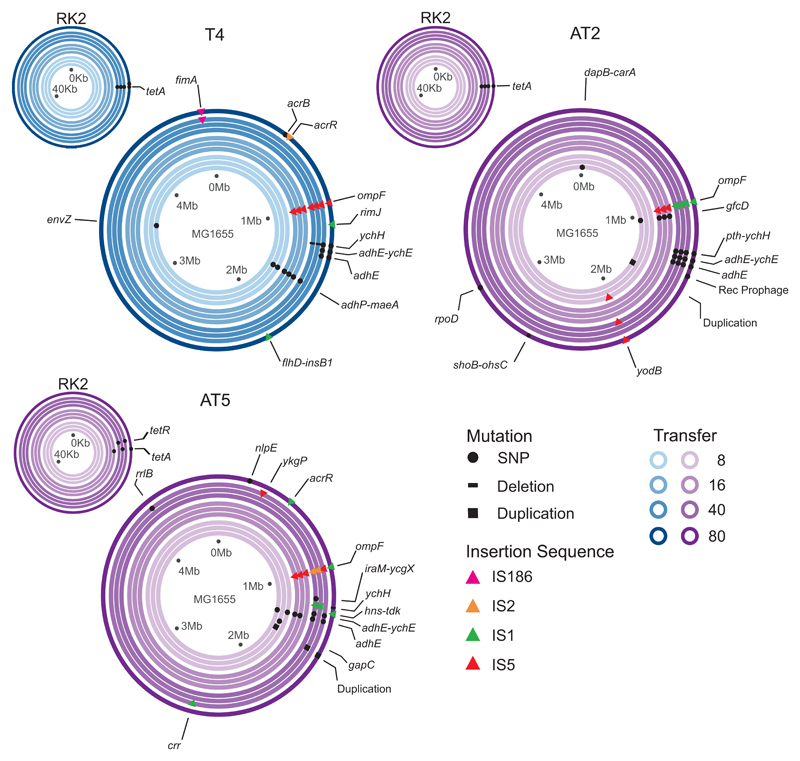
Fig. 2.
Genomic changes observed at transfers 8, 16, 40 and 80 within populations under tetracycline treatment. Concentric rings represent E. coli chromosomes or RK2 plasmids, ring colour represent the time point the clones were isolated (see keys); inner lighter rings to outer darker rings represent progression through time. Sets of three concentric rings are representative of three independent clones isolated from the same time-point within the populations. Points on the plot represent mutations at specific loci, circles = non-synonymous mutations, bars = deletions, squares = duplications, and triangles = IS elements (colours show type of IS element, see key). Genome sequences from transfer 80 are previously published in [7].

