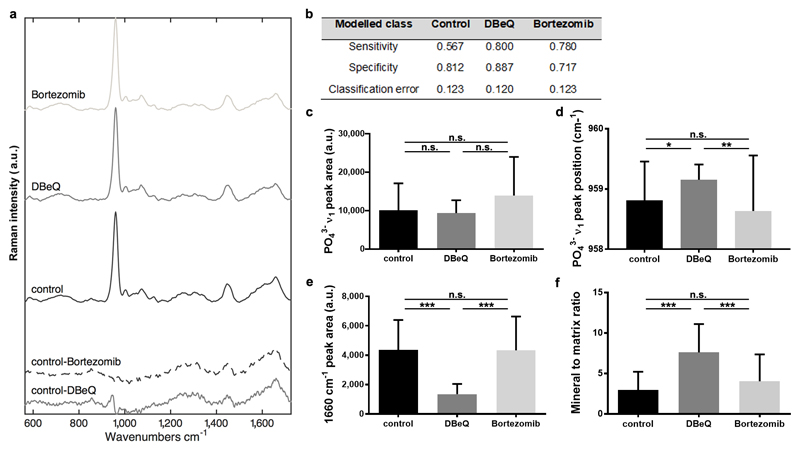
Fig. 2. VCP/p97 inhibition alters mineralised nodule composition as determined by Raman spectroscopy.
a, Mean Raman spectra collected from mineralised nodules formed in control, DBeQ- and bortezomib-treated hMSC cultures. Difference spectra of DBeQ- and bortezomib-treated cultures compared to controls are shown in the bottom of the panel. Spectra are offset on the y-axis for clarity. b, Table showing the fraction of spectra in DBeQ- and bortezomib-treated groups and the control that could be classified by sensitivity, specificity and classification error using a cross-validated 6-component Partial Least Squares-Discriminant Analysis model. c, Univariate analyses of the mean PO43- ν1 peak area at ~960 cm-1 in control, DBeQ- and bortezomib-treated cultures, d, mean PO43- ν1 peak position, and e, 1660 cm-1 peak area. f, Mean mineral to matrix ratio in control, DBeQ- and bortezomib-treated cultures. In c,-f, data are means + SD and a Kruskal-Wallis non-parametric test followed by Dunn’s Multiple Comparison test was used to detect statistical significance. *p < 0.05, **p < 0.01 and ***p < 0.001. For detailed n and p values see Supplementary Table 5.

