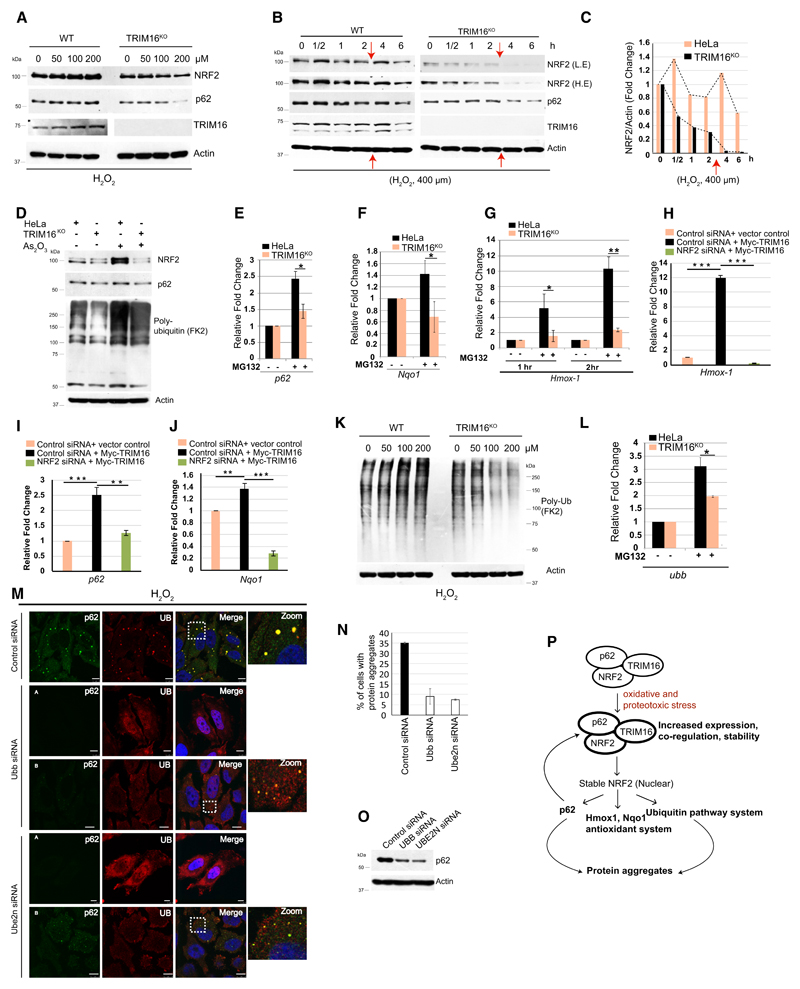
Figure 5. TRIM16 regulates stress-induced NRF2 response including ubiquitination of protein aggregates.
A Western blot analysis of HeLa and TRIM16KO lysates of cells treated with increasing concentrations of H2O2 as specified and probed with antibodies as indicated.
B WB analysis of HeLa and TRIM16KO lysates of cells treated with 400 μM of H2O2 for different durations as indicated and probed with antibodies as shown. The red arrows indicate the time point where the cells were retreated with 400 μM of H2O2. L.E, low exposure; H.E, high exposure.
C Densitometric analysis of NRF2 band intensity (in panel B) normalized with actin.
D WB analysis of HeLa and TRIM16KO lysates of cells treated with 2.5 μM (2 h) of As2O3.
E–G RNA isolated from HeLa and TRIM16KO cells, untreated or treated with MG132 (20 μM, 2 h), were subjected to qRT–PCR with primers of genes as indicated. The fold induction in MG132-treated samples is calculated relative to untreated samples. Mean ± SD, n = 3, *P < 0.05, **P < 0.005 (Student’s unpaired t-test).
H–J RNA isolated from control and NRF2 knockdown HeLa cells transfected with control vector or Myc-TRIM16 subjected to qRT–PCR with primers of genes as indicated. Mean ± SD, n = 3, **P < 0.005, ***P < 0.0005 (Student’s unpaired t-test).
K Western blot analysis of HeLa and TRIM16KO lysates of cells treated with h increasing concentrations of H2O2 as specified and probed with antibodies as indicated.
L Densitometric analysis of Ub smear intensity normalized with actin. Mean ± SD, n = 3, *P < 0.05 (Student’s unpaired t-test).
M Representative confocal images of control, Ubb, and Ube2n siRNA transfected cells treated with H2O2 (200 μM, 2 h) and IF analysis was performed with Ub and p62 antibodies. Scale bar: 10 μM.
N The graph shows the percentage of cells with protein aggregates. Data from ≥ 10 microscopic fields for each condition (40×), n = 2, mean ± SD.
O Western blot analysis of Ubb and Ube2n siRNA transfected cell lysates with antibodies as indicated.
P Pictorial representation of results obtained in Figs 1–5.
Source data are available online for this figure.

