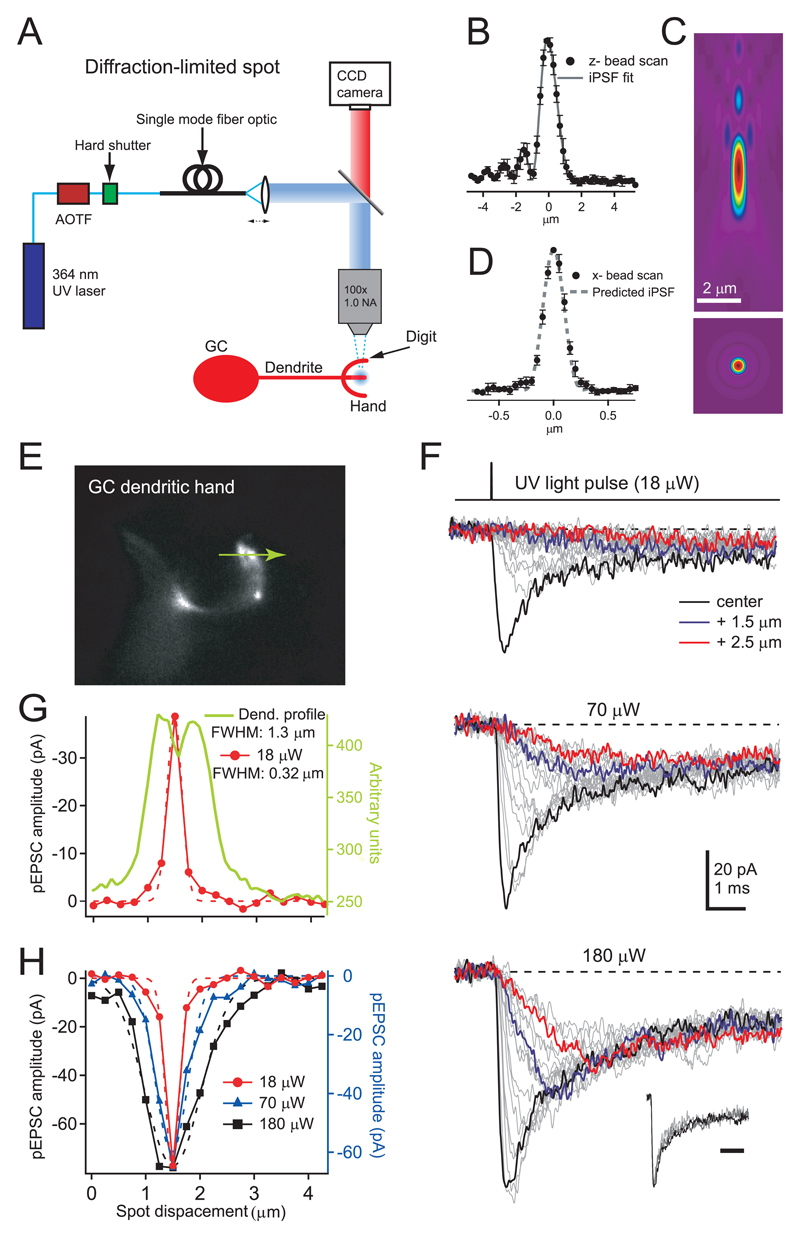
Figure 4. Spatial dependence of small-spot pEPSCs on GC dendritic hands.
A, Optical configuration used to form a small diffraction-limited UV illumination spot. The small spot was generated by collimating the light emitted from the optical fiber so that it formed a parallel beam with a Gaussian profile that filled the back aperture of the microscope objective.
B, Averaged fluorescence emitted by 110 nm fluorescent beads as a function of axial distance (200 nm steps) when illuminated with a small UV spot (n = 5, filled circles). Gray line shows the fit of the theoretical iPSF including spherical aberrations.
C, x-z (top) and x-y (bottom) intensity profile of the theoretical 3D iPSF determined from fit of the data in B.
D, Averaged fluorescence intensity distribution of a laterally scanned 110 nm bead (50 nm steps; n = 5; filled circles). Dashed line shows the predicted x-line profile of the fitted iPSF from B.
E, Image of a GC dendritic hand visualised with Alexa 594. The green arrow indicates the length (4 μm) and location over which uncaging responses were elicited.
F, pEPSCs evoked with a brief (20 μs) diffraction-limited UV illumination spot during local perfusion of 10 mM MNI-glutamate at 3 different light intensities elicited at different locations (250 nm apart) across the dendritic hand shown in E (photolysis scan). Thick black traces show fastest-rising responses. Inset shows normalized pEPSCs, for each of the 3 laser intensities, recorded from the location in which the fast-rising current was measured. Inset scale bar is 2 ms.
G, Current amplitudes for the lowest intensity (18 μW) measured at the time the largest current peaked (filled red circles) plotted as a function of distance. Dashed line indicates a Gaussian fit. Green line shows the intensity line profile from the CCD image indicating the location of the dendritic structure (E) from which the pEPSCs were recorded.
H, Plot of amplitude at the time that the largest current peaked as a function of distance with Gaussian fits for the two highest intensities together with scaled data from G (red).

