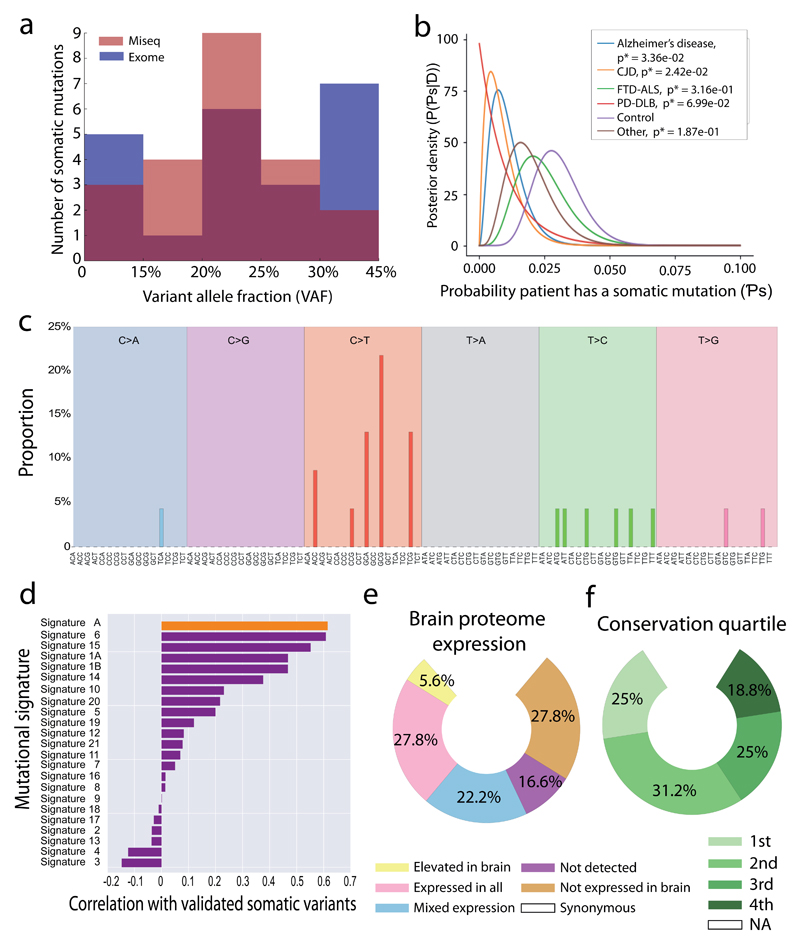
Figure 2. Distribution and mutational profile of the validated somatic variants.
(a) Distribution of allele frequencies for the validated variants in the study are shown, with the relative VAF for each allele as detected on both the MiSeq (pink), Exome sequencing (blue), and overlapping between two platforms (purple) shown. (b) Probability of a variant occurring in each cohort assuming a uniform prior probability and that each person is a Bernoulli trial with probability Ps of developing a mutation. (c) Mutational signature of all validated somatic variants. The mutated allele plus the flanking 3’ and 5’ base are shown. (d) Correlation between the mutational signature of validated somatic variants and the mutational profiles observed in de novo germline variants detected in the population21 (top orange bar – Signature A) and 21 forms of cancer 20 (purple bars). The probable disease associations, or type of cancer in which the signature was detected by Alexandrov (2013) are shown next to the signature number. The Pearson’s correlation coefficient is shown for each signature. (e) Proportion of validated variants within genes grouped by brain proteome expression 22. (f) Proportion of validated variants based on each quartile of the gene conservation scores within the germline (4th quartile being the most conserved in the germ line).

