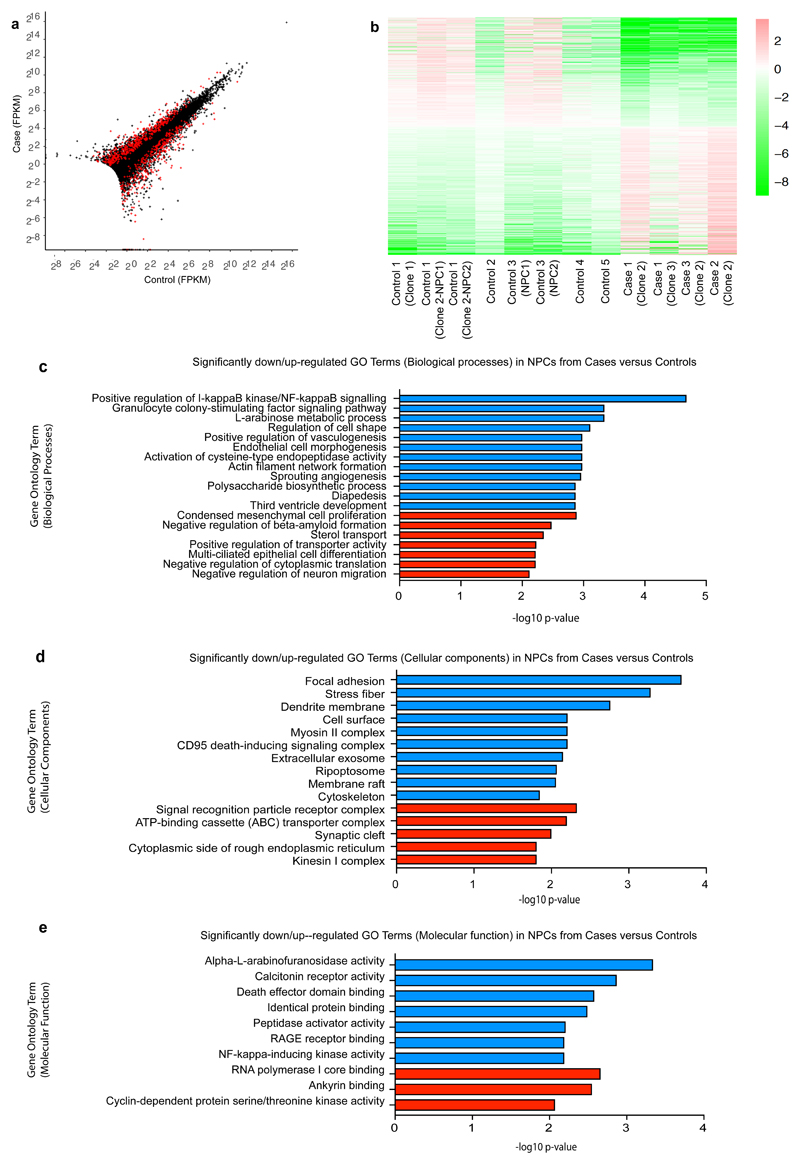
Figure 3. RNA sequencing data highlights differences in I-kappaB kinase and NF-kappaB signalling pathways as well as focal adhesion, regulation of cell shape, actin filament network, cytoskeleton, and alpha-L-arabinofuranosidase activity.
(a) Representation of the differential expression results. Each cross is a gene, plotted with its mean abundance (measured in "fragments per kilobase per million mapped reads" (FPKM)) in cases versus controls. Very low abundance genes (those with mean FPKM across all samples < 0.5) have been filtered out. Red crosses are those genes that were called as differentially expressed. Genes with zero mean FPKM are drawn superimposed on the axes. (b) Heatmap of differentially expressed genes. Colours indicate log2(gene abundance in sample / mean abundance for this gene). Ordering is from most down-regulated in cases to most up-regulated. Graphs showing the most significantly down-regulated (blue) or up-regulated (red) gene ontology (GO) terms for (c) biological processes, (d) cellular components and (e) molecular function.

