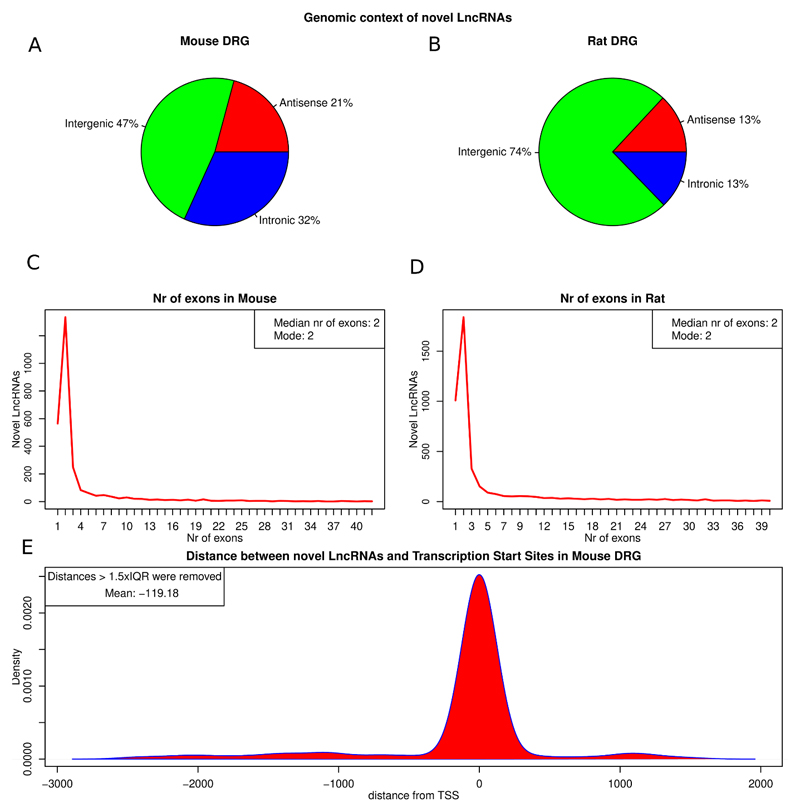
Figure 2.
Attributes of novel LncRNAs identified in mouse and rat.
A, B: Classification of novel LncRNAs according to genomic context in mouse (A) and rat (B). C, D: Exon distribution of novel LncRNAs in mouse (C) and rat (D). E: Kernel density of distances between novel LncRNAs and 5’ CAGE TSS. Distance is measured in genomic bases. Outlying distances > 1.5 * IQR of the distribution were removed (All data in supplementary figure 2). Median distance of TSS is 0bp of the predicted LncRNA transcript.

