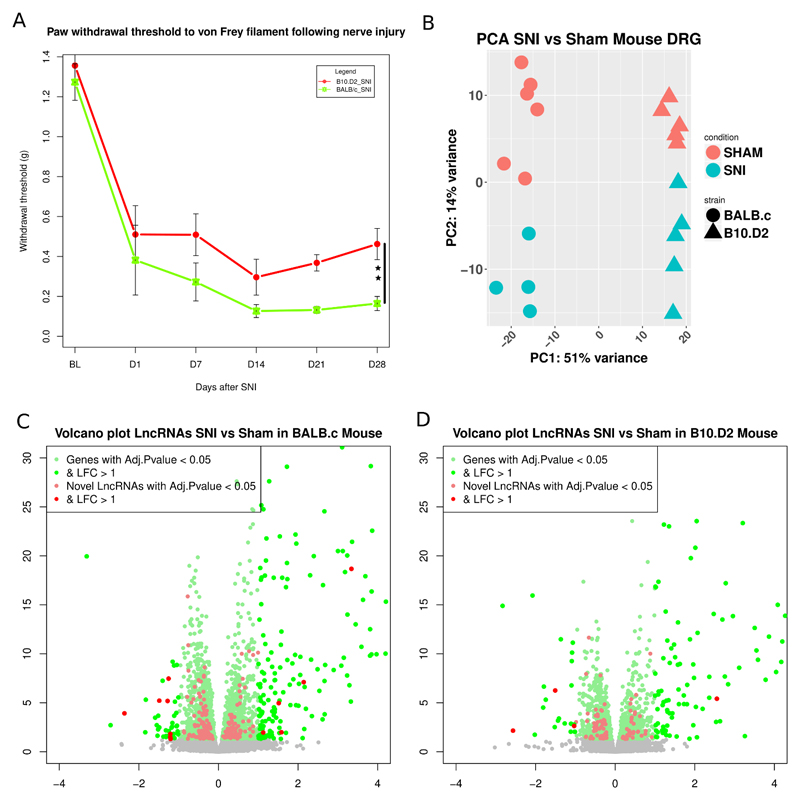
Figure 7.
DRG transcriptional response in mouse following peripheral neuropathy.
A: Hindpaw withdrawal thresholds to von Frey filament stimulation + SEM in grams. We calculated the area over the curve (AOC) for each strain and obtained the percentage of maximum induced hypersensitivity. Two way ANOVA showed a significant effect of surgery and a significant interaction of strain:surgery (p= 0.001). One-way ANOVA between SNI groups on D28 showed significant difference in % of maximum hypersensitivity (p=0.002). Black bar shows comparison between SNI groups, p < 0.01 : **. N=12 per strain, N=6 per SNI group. B: PCA plot of samples based on the expression of novel LncRNAs and ENSEMBL genes (1st 10000 genes ranked by their standard deviation) in mouse DRG. Axis represent PCs and show percentage of original data’s variance explained by the respective PC. C, D: Volcano plots of the whole gene set for BALB/c strain (C) and B10.D2 strain (D). X-axis Log2(Fold Change), y-axis -log10(FDR adjusted p.value). Significantly DE ENSEMBL annotated genes and novel LncRNAs are highlighted.

