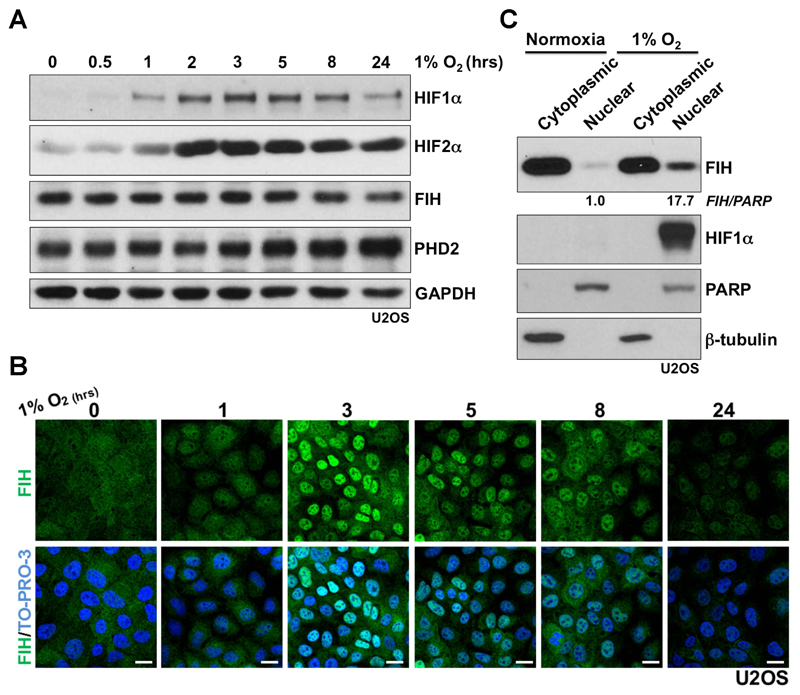
Figure 1. Evidence that hypoxia induces nuclear entry of FIH.
(A) Protein levels of HIF1α, HIF2α, FIH and PHD2 in U2OS cells upon hypoxia (1% O2) treatment at the indicated time points. GAPDH was used as a loading control.
(B) Immunofluorescence staining of FIH (green) in U2OS cells upon hypoxia (1% O2) at the indicated time points. TO-PRO-3 (blue) was used to stain nuclei. Scale bar: 20 µm.
(C) Protein levels of FIH and HIF1α from cytoplasmic or nuclear fractions in U2OS cells in normoxia or hypoxia (1% O2, 3 hours). β-tubulin and PARP were used as loading controls for the cytoplasmic and nuclear fractions respectively. Figures beneath lanes 2 and 4 are relative intensities of nuclear FIH in normoxia and hypoxia. Note that different quantity of cytoplasmic versus nuclear extract were loaded.

