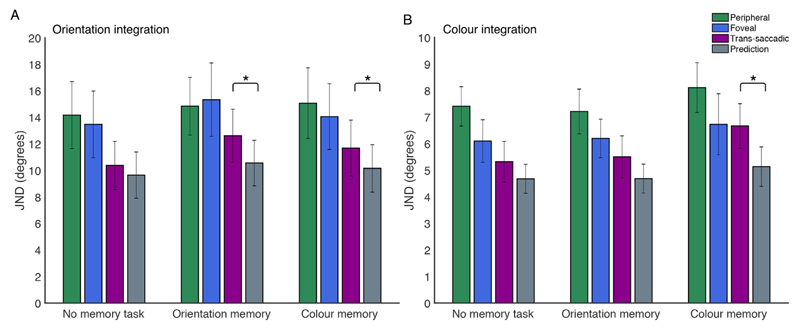
Fig. 3.
Average JNDs in the integration task for orientation integration (A) and colour integration (B). Peripheral trials (green), foveal trials (blue), trans-saccadic trials (purple), and predictions (grey) are shown for conditions when there was a concurrent memory task (colour or orientation) or no concurrent memory task. Error bars represent 95% confidence intervals. Conditions in which there was a significant difference between the predicted and observed trans-saccadic performance are marked with an asterisk.

