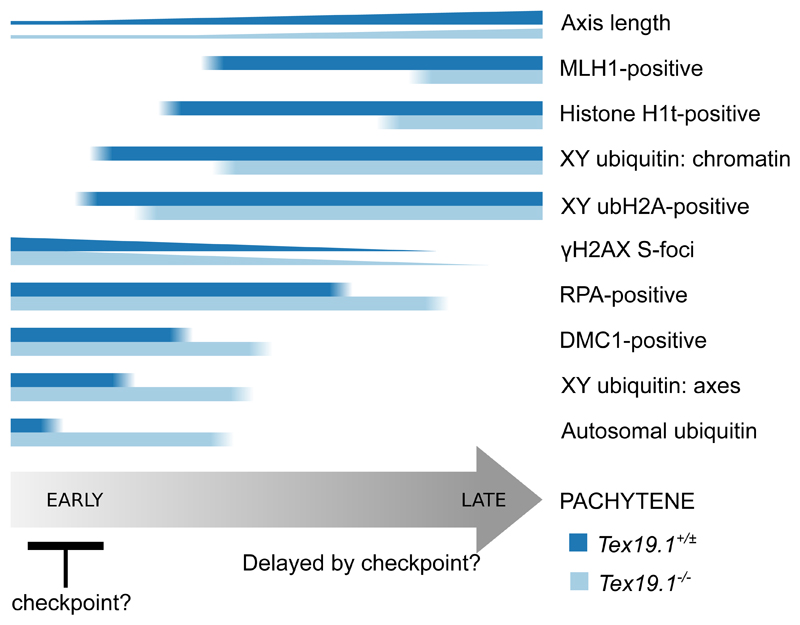
Fig. 11. Schematic Diagram Showing Delayed Progression Through Pachytene in Autosomally Synapsed Pachytene Tex19.1-/- Spermatocytes.
Summary of aspects of progression through pachytene analysed in this study. Horizontal bars indicate the proportion of pachytene nuclei expressing different markers of progression through pachytene. Number of γH2AX foci and length of axis are indicated by the height of the bars. Proportions of DMC1 and RPA positive nuclei are estimated from the violin plots in Online Resource 1. The differences in the behaviour of these markers in autosomally synapsed pachytene Tex19.1+/± and Tex19.1-/- spermatocytes is indicated by the blue bars. Tex19.1-/- spermatocytes appear to activate a Spo11-dependent recombination checkpoint in early pachytene that delays progression to late pachytene.

